Observability Platform

Architecture Views

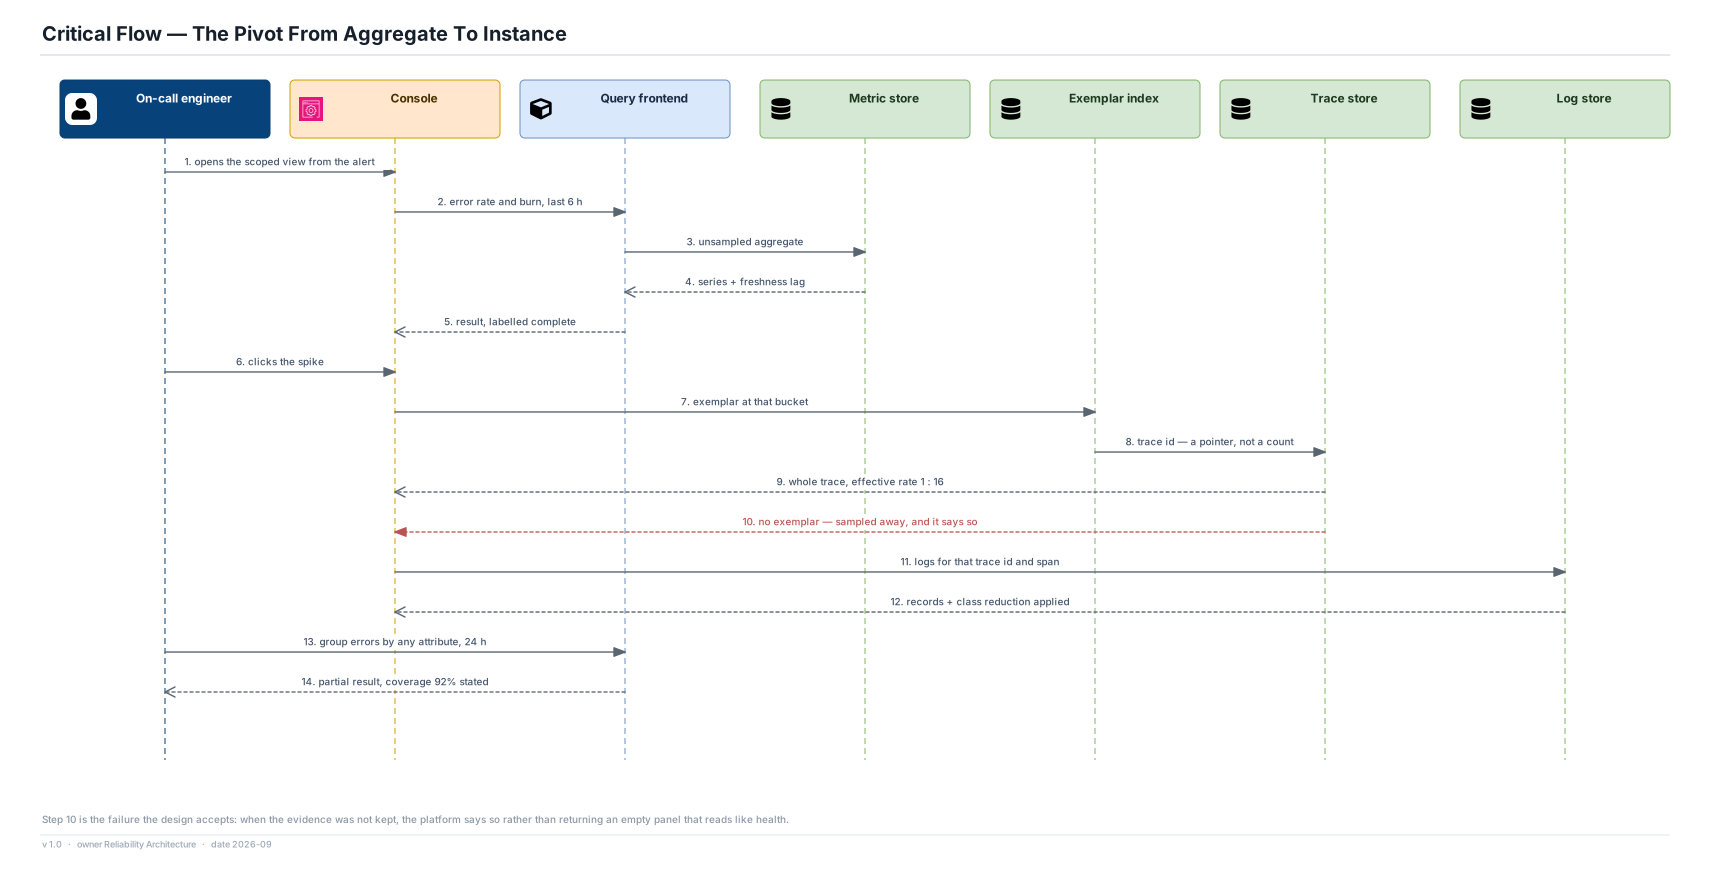
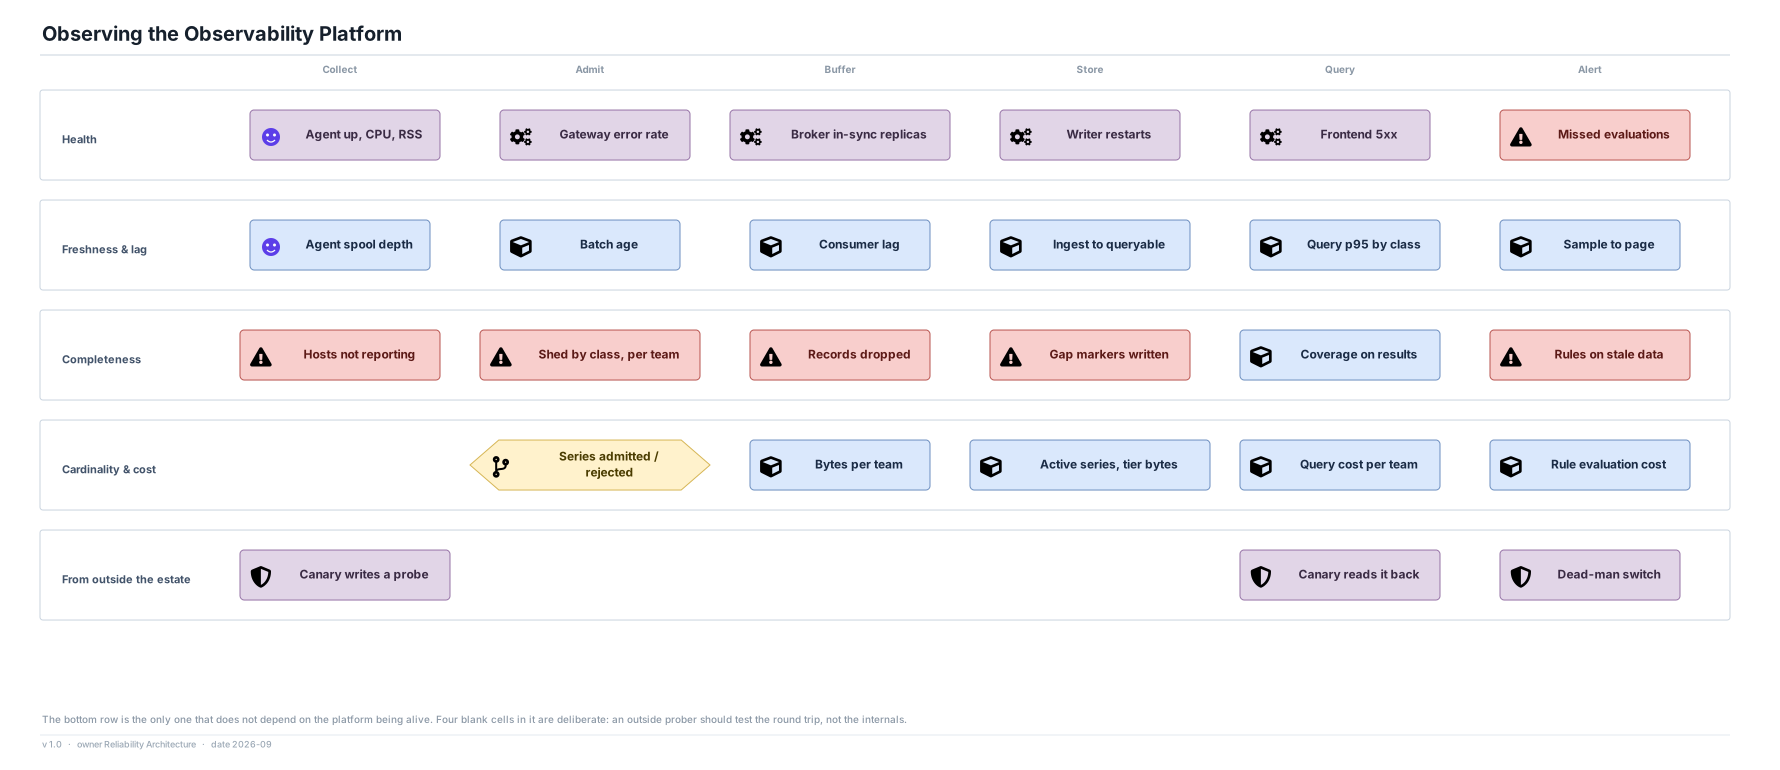
25 views, in reading order. Every view ships three ways: an HTML page, an SVG that re-opens in diagrams.net fully editable, and draw.io source.

The internal platform that answers "is it broken, where, and since when" for 900 services across three AWS regions. Read it in seven acts. The one idea to carry through all of them is in view 08: aggregates are complete and instances are sampled, the split is enforced in the pipeline, and nothing is ever counted from the sampled corpus.

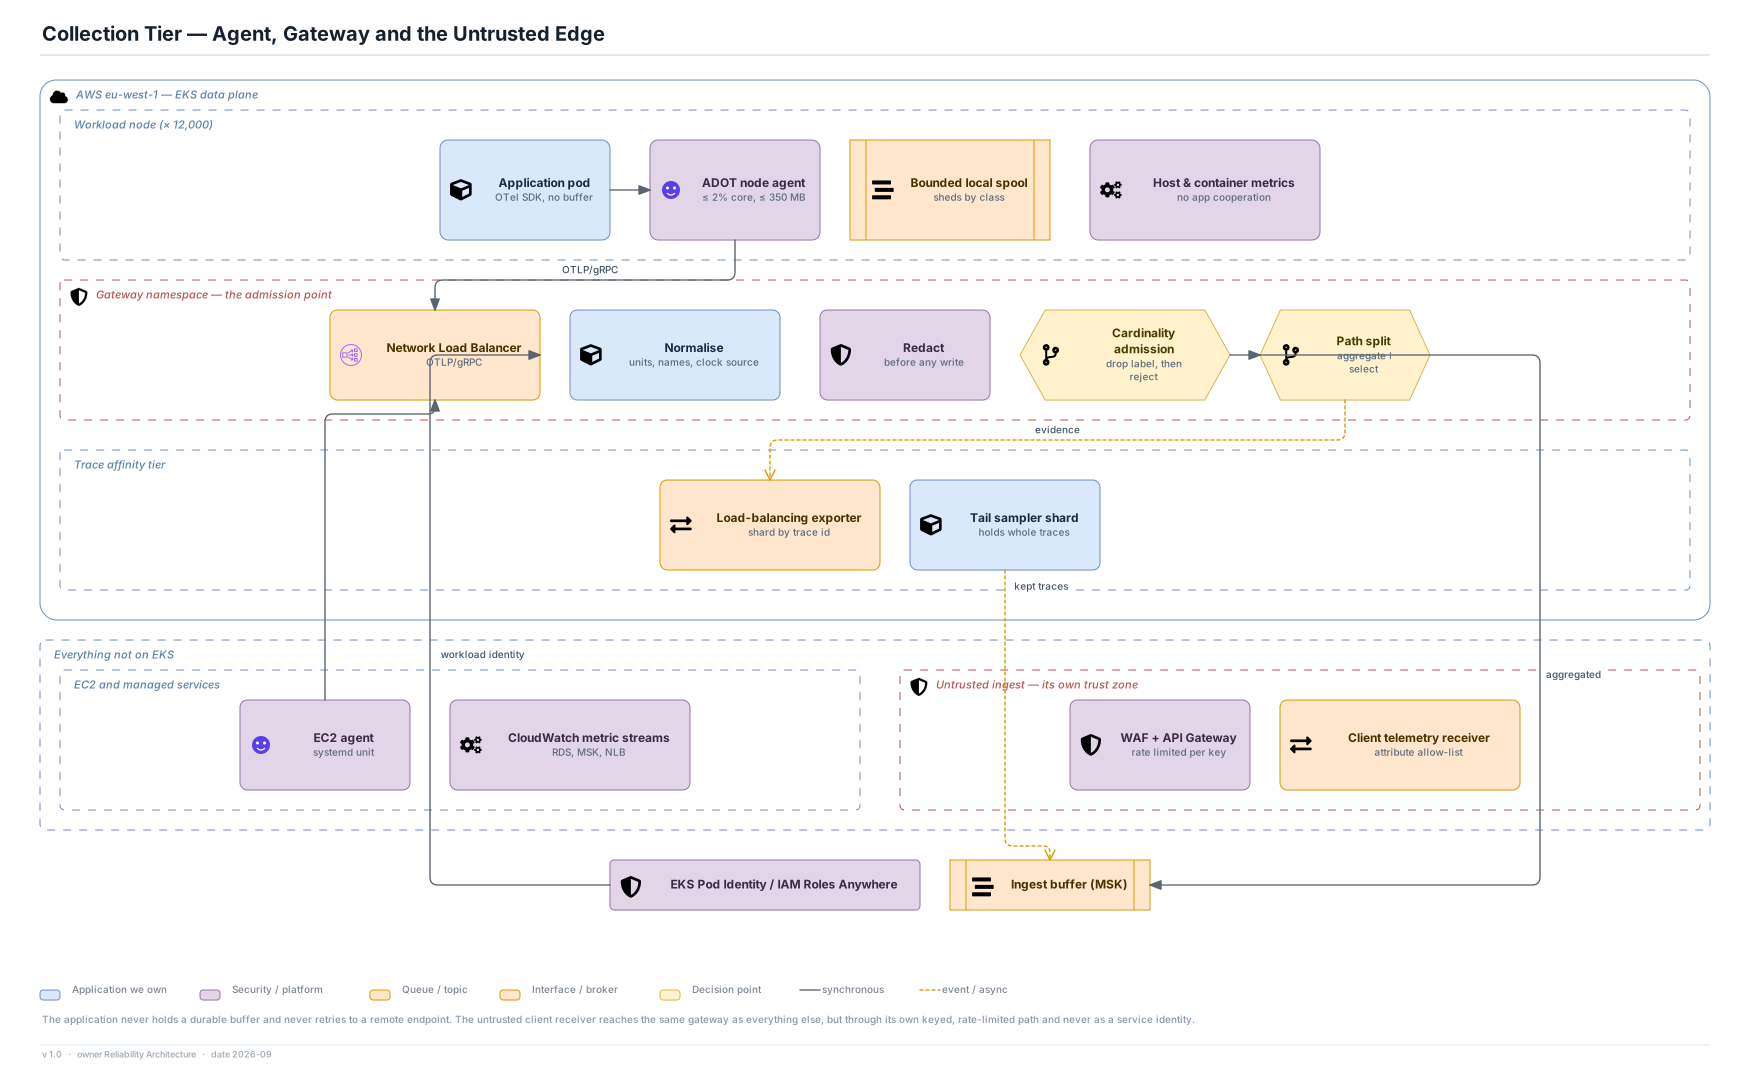
Context and scope

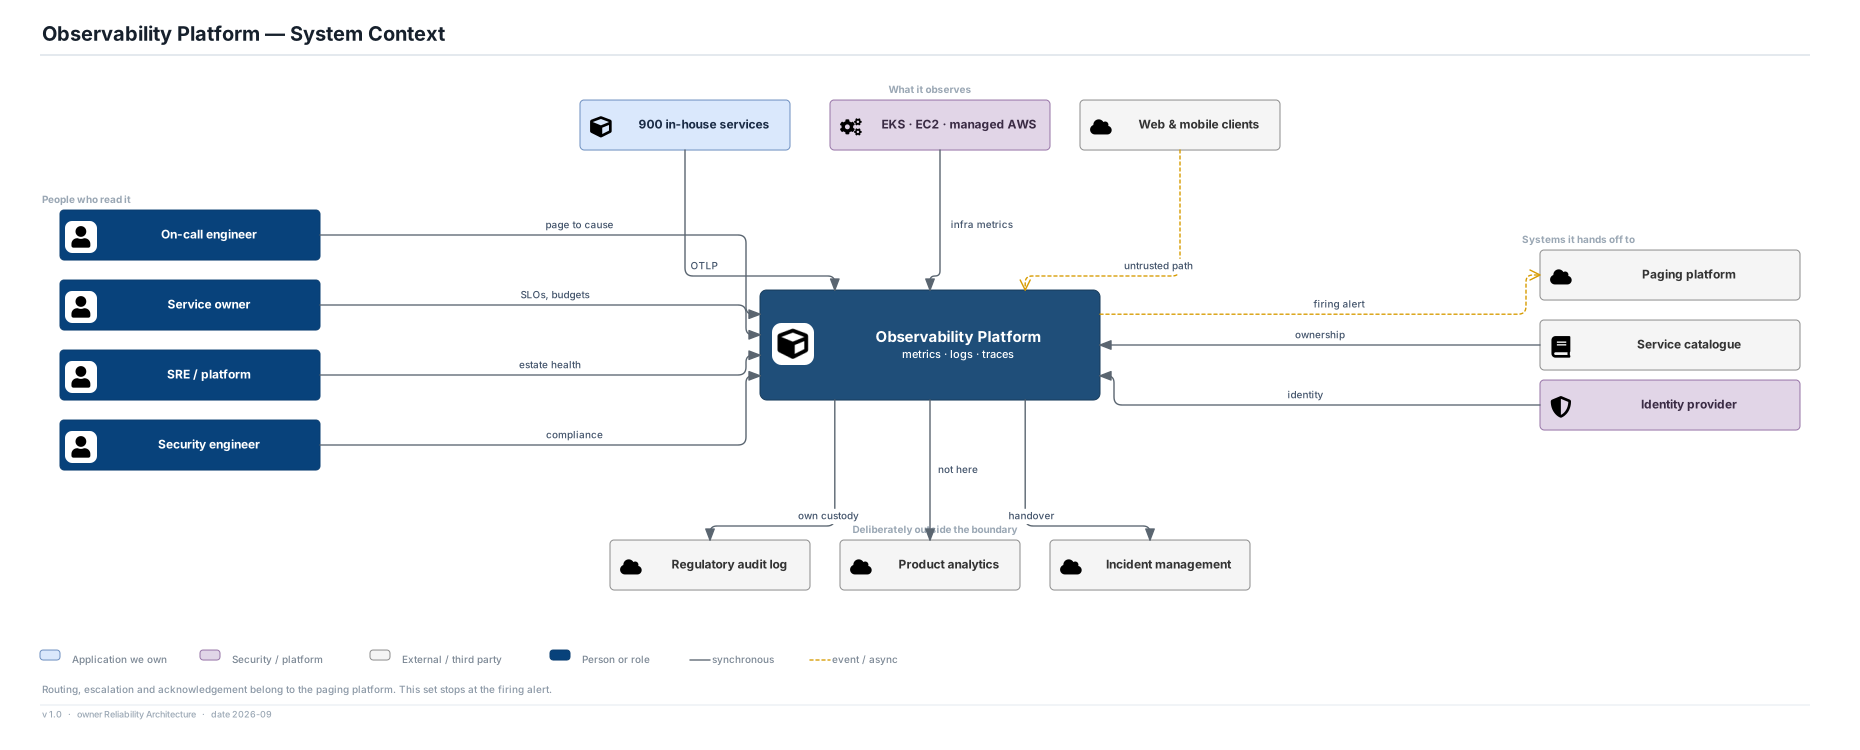
Who uses the platform, what it observes, what it hands off, and the three things it deliberately does not own.

People and journeys

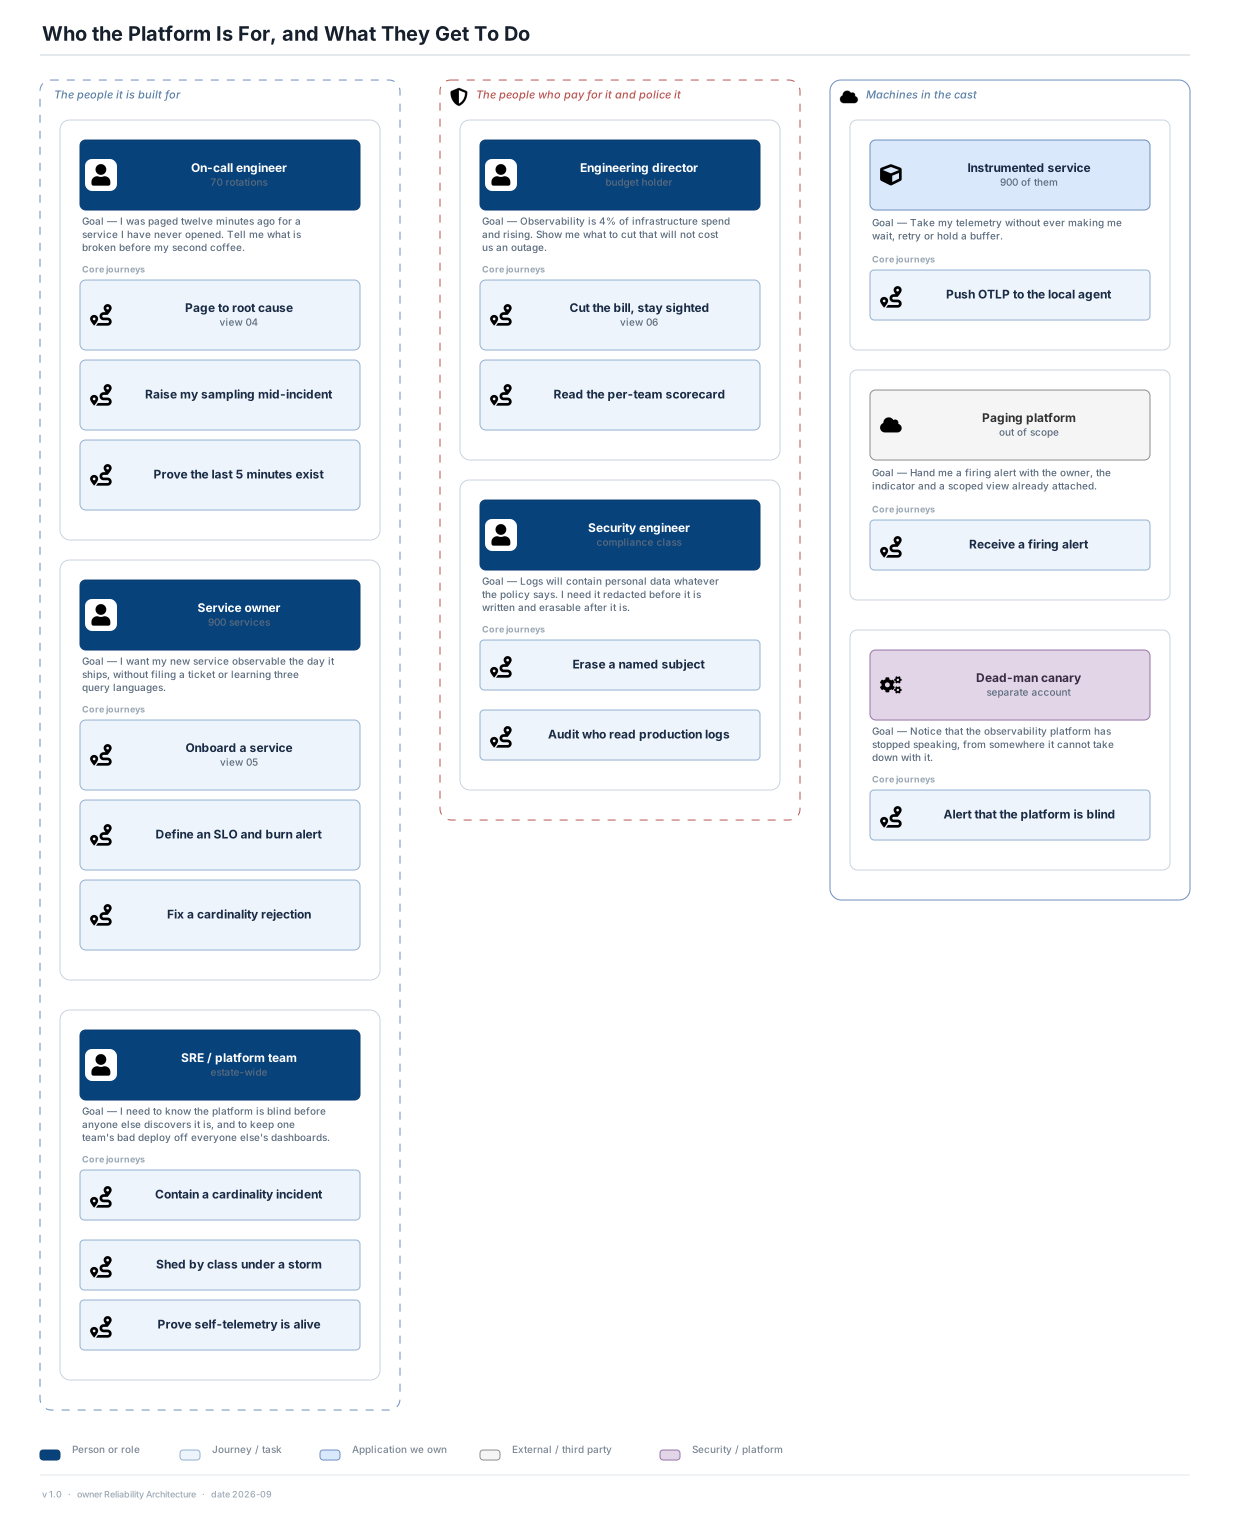
The five humans and three machines the platform serves, and the three journeys that decide whether it was worth building.
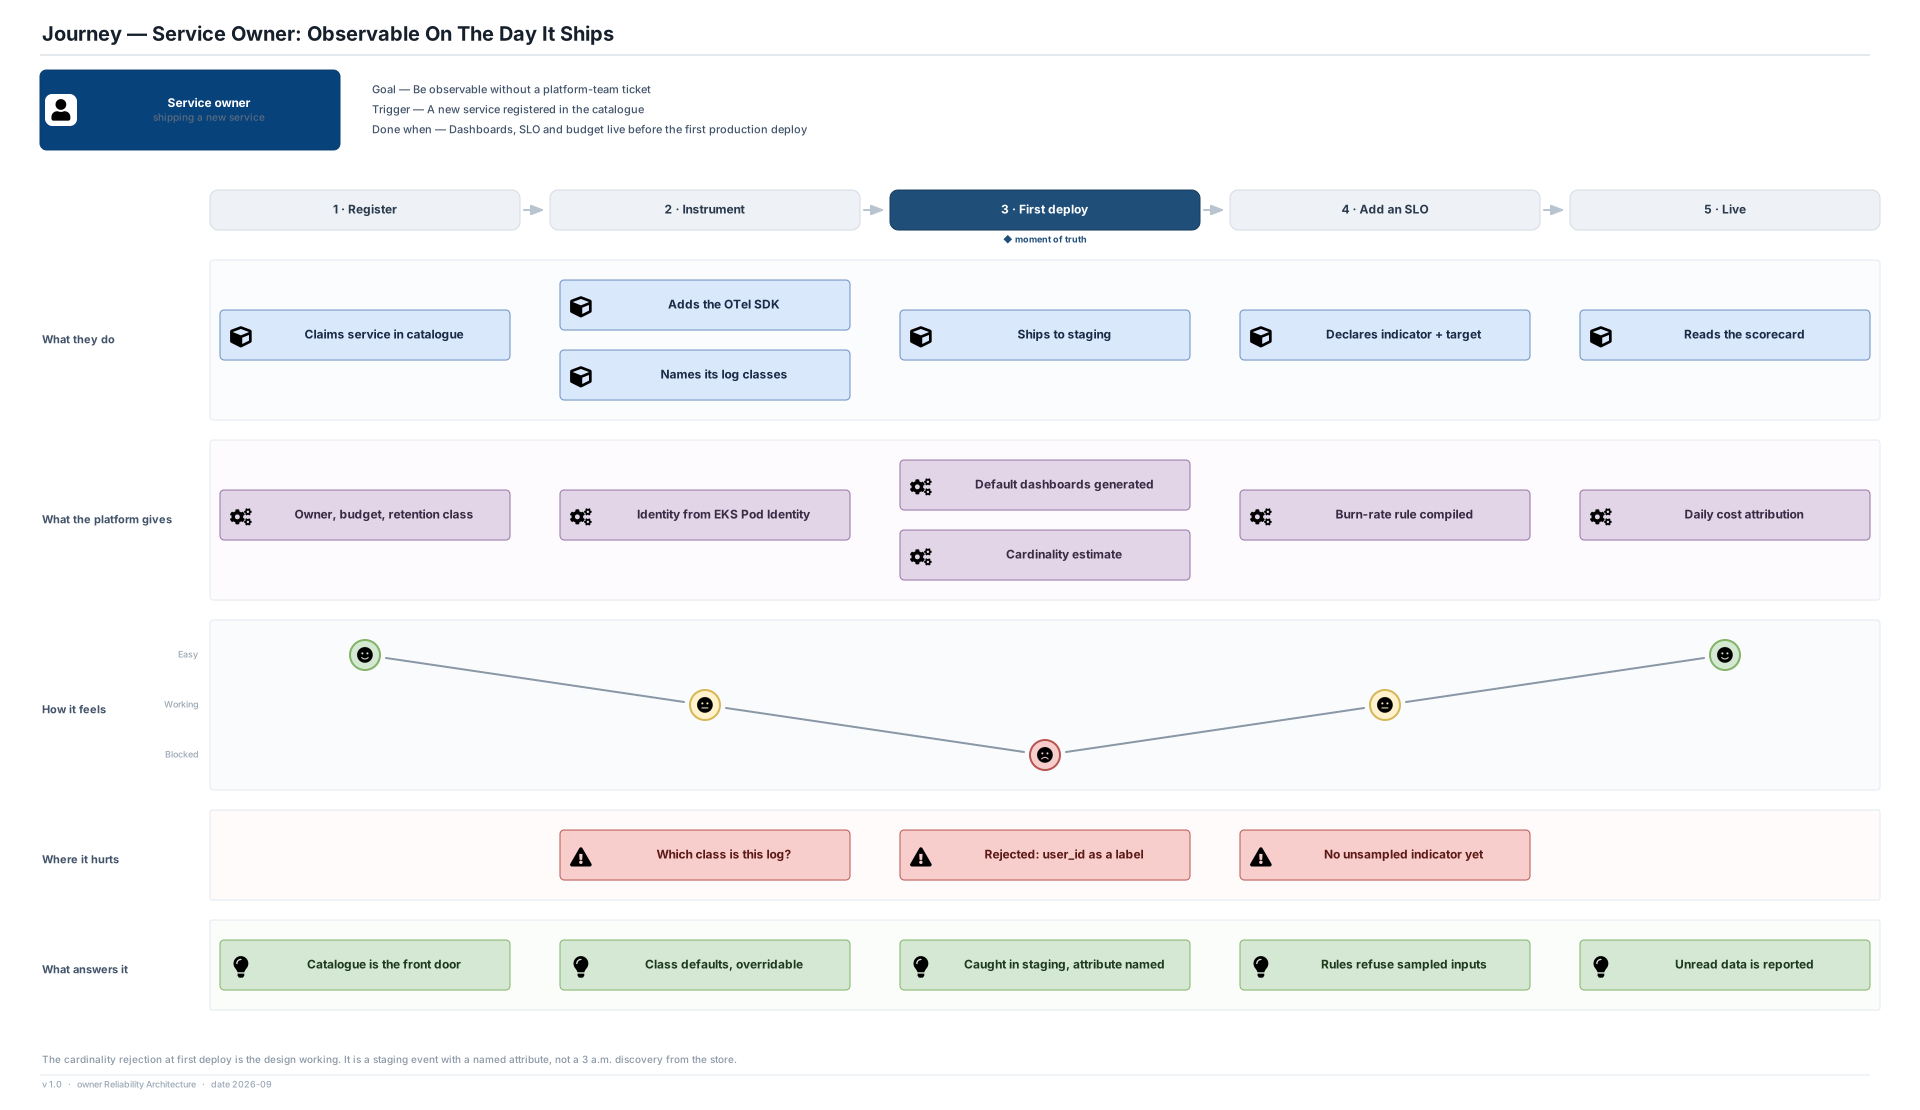
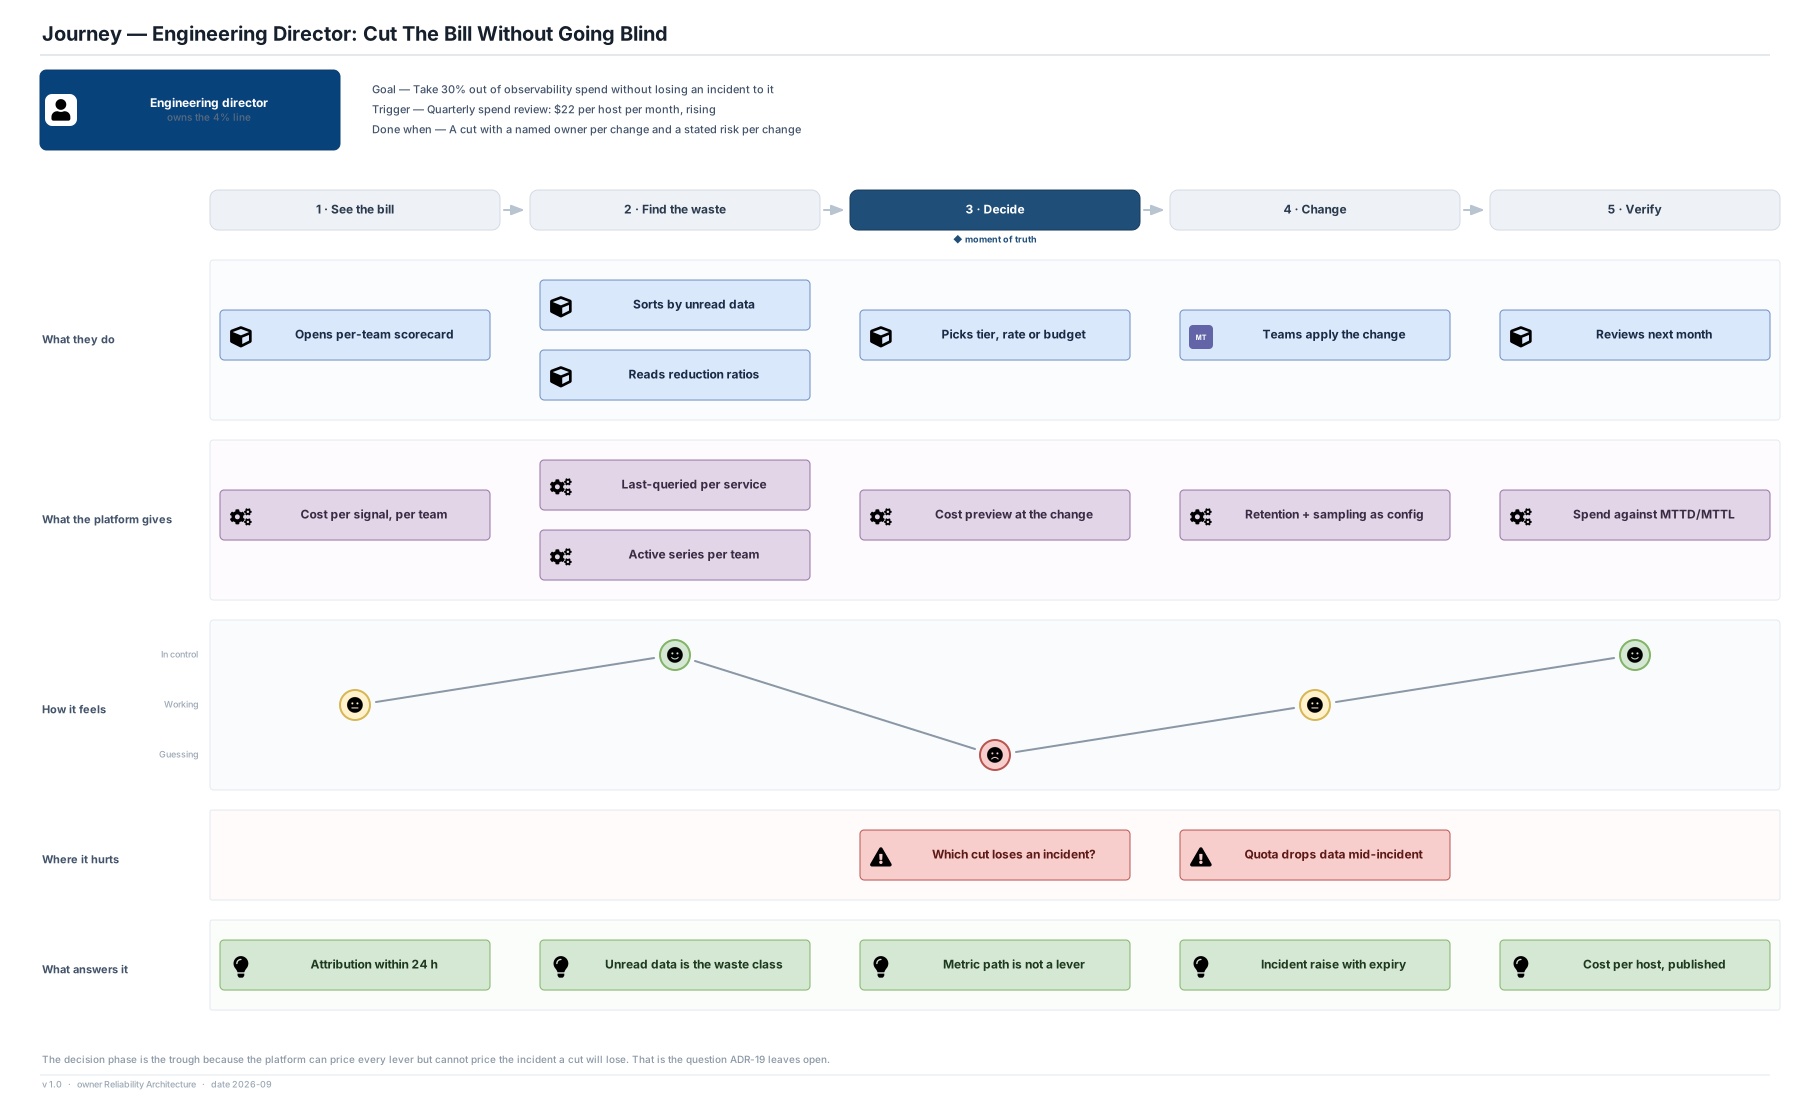
03 The people it is built for On-call engineer 70 rotations Goal — I was paged twelve minutes ago for a service I have never opened. Tell me what is broken before my second coffee. Core journeys Page to root cause view 04 Raise my sampling mid-incident Prove the last 5 minutes exist Service owner 900 services Goal — I want my new service observable the day it ships, without filing a ticket or learning three query languages. Core journeys Onboard a service view 05 Define an SLO and burn alert Fix a cardinality rejection SRE / platform team estate-wide Goal — I need to know the platform is blind before anyone else discovers it is, and to keep one team's bad deploy off everyone else's dashboards. Core journeys Contain a cardinality incident Shed by class under a storm Prove self-telemetry is alive The people who pay for it and police it Engineering director budget holder Goal — Observability is 4% of infrastructure spend and rising. Show me what to cut that will not cost us an outage. Core journeys Cut the bill, stay sighted view 06 Read the per-team scorecard Security engineer compliance class Goal — Logs will contain personal data whatever the policy says. I need it redacted before it is written and erasable after it is. Core journeys Erase a named subject Audit who read production logs Machines in the cast Instrumented service 900 of them Goal — Take my telemetry without ever making me wait, retry or hold a buffer. Core journeys Push OTLP to the local agent Paging platform out of scope Goal — Hand me a firing alert with the owner, the indicator and a scoped view already attached. Core journeys Receive a firing alert Dead-man canary separate account Goal — Notice that the observability platform has stopped speaking, from somewhere it cannot take down with it. Core journeys Alert that the platform is blind Who the Platform Is For, and What They Get To Do Person or role Journey / task Application we own External / third party Security / platform v 1.0 · owner Reliability Architecture · date 2026-09 Actors and Their Core Journeys Five humans, three machines, and what each of them actually gets to do. HTML page SVG draw.io

Structure

The layers, the completeness boundary that defines the architecture, and the components on each side of it.
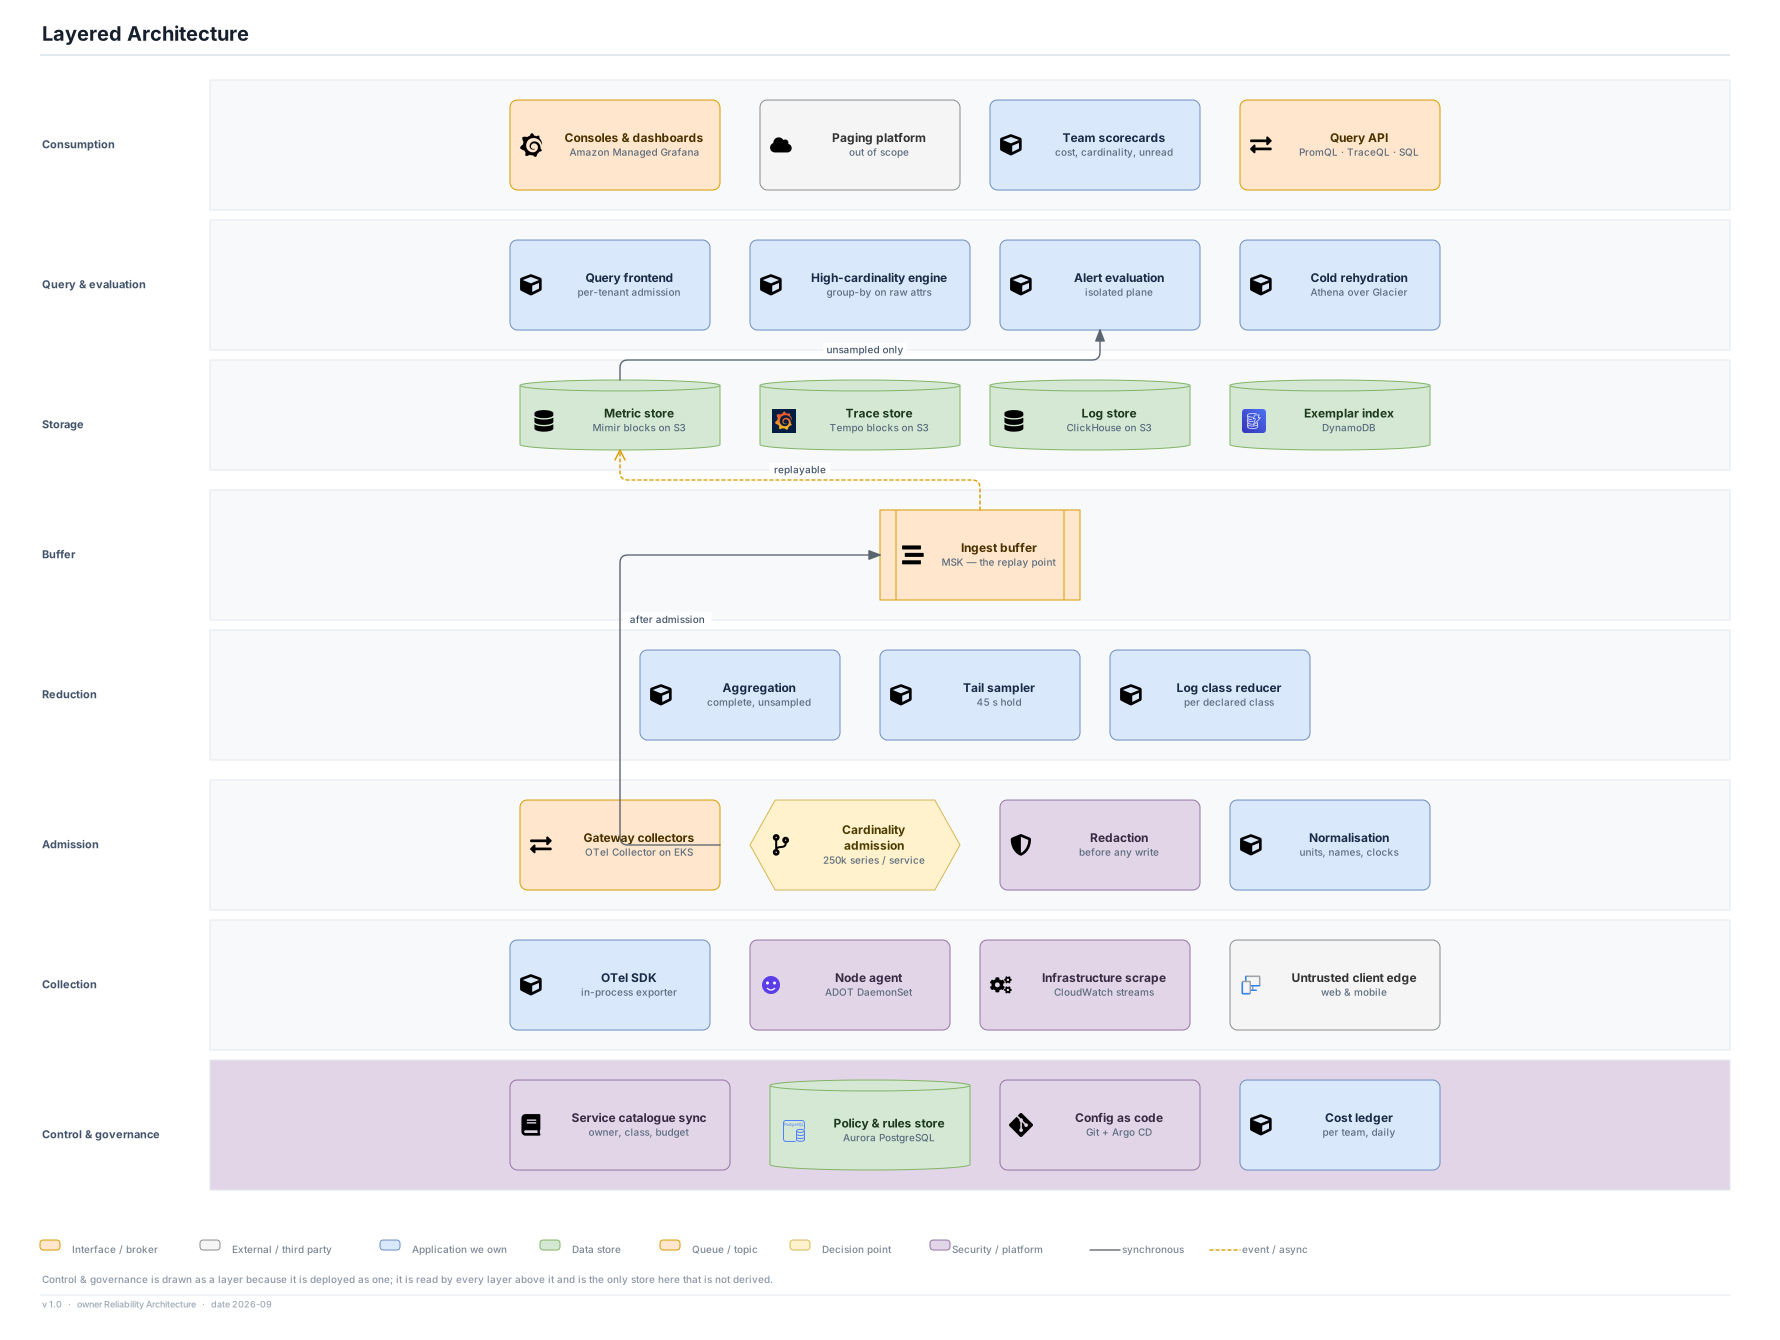
07 Consumption Consoles & dashboards Amazon Managed Grafana Paging platform out of scope Team scorecards cost, cardinality, unread Query API PromQL · TraceQL · SQL Query & evaluation Query frontend per-tenant admission High-cardinality engine group-by on raw attrs Alert evaluation isolated plane Cold rehydration Athena over Glacier Storage Metric store Mimir blocks on S3 Trace store Tempo blocks on S3 Log store ClickHouse on S3 Exemplar index DynamoDB Buffer Ingest buffer MSK — the replay point Reduction Aggregation complete, unsampled Tail sampler 45 s hold Log class reducer per declared class Admission Gateway collectors OTel Collector on EKS Cardinality admission 250k series / service Redaction before any write Normalisation units, names, clocks Collection OTel SDK in-process exporter Node agent ADOT DaemonSet Infrastructure scrape CloudWatch streams Untrusted client edge web & mobile Control & governance Service catalogue sync owner, class, budget Policy & rules store Aurora PostgreSQL Config as code Git + Argo CD Cost ledger per team, daily after admission replayable unsampled only Layered Architecture Interface / broker External / third party Application we own Data store Queue / topic Decision point Security / platform synchronous event / async Control & governance is drawn as a layer because it is deployed as one; it is read by every layer above it and is the only store here that is not derived. v 1.0 · owner Reliability Architecture · date 2026-09 Layered Architecture Eight layers, read bottom to top — and the one drawn as a layer because it is deployed as one. HTML page SVG draw.io

Data

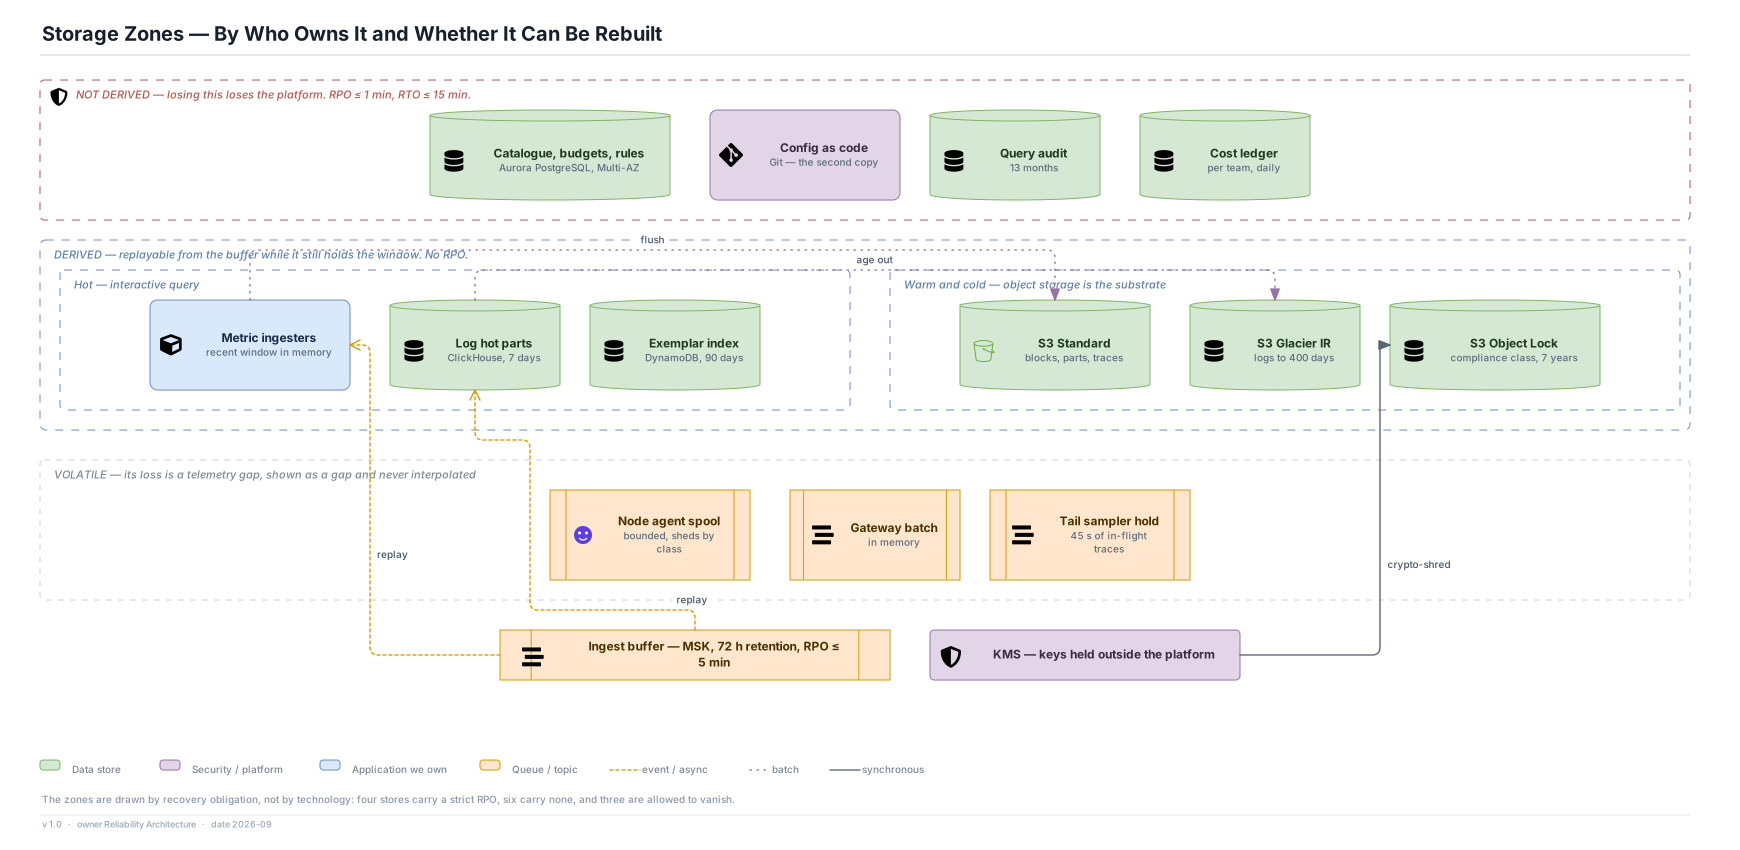
What is stored, what can be rebuilt, what may be lost, and how long each of it lives.

Runtime

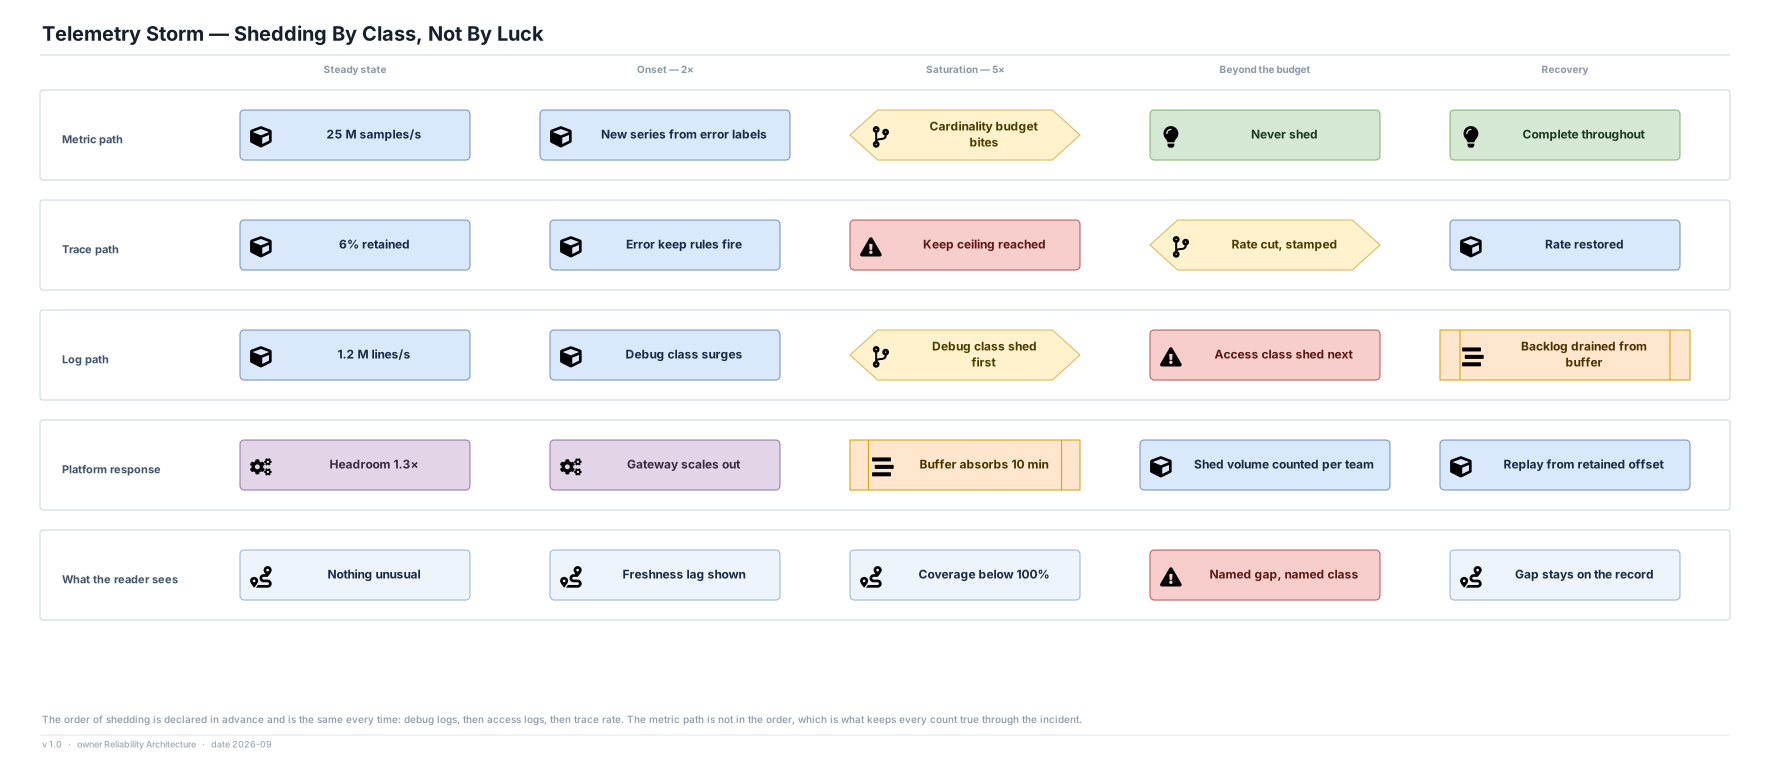
A sample becoming a page, a trace being selected, an engineer pivoting from a chart to an instance, and all three under a storm.

Operations

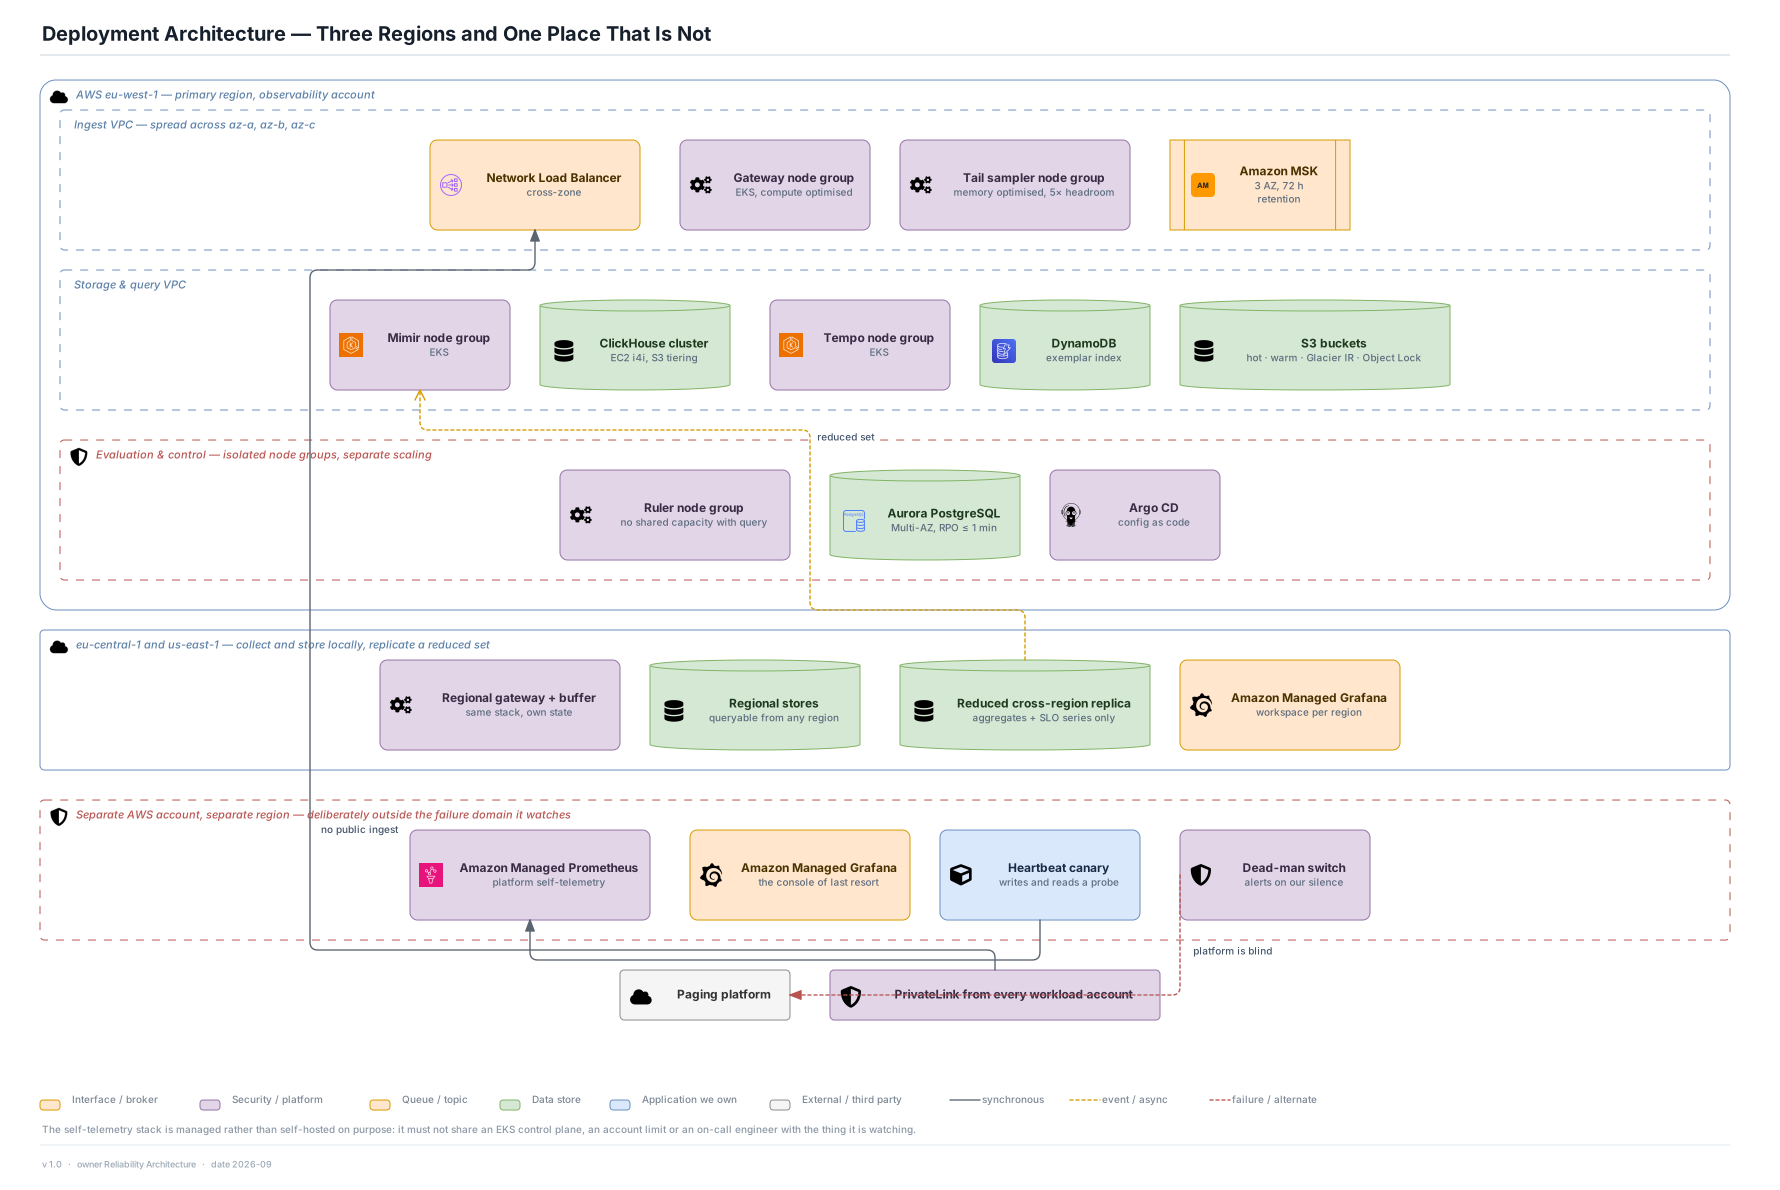
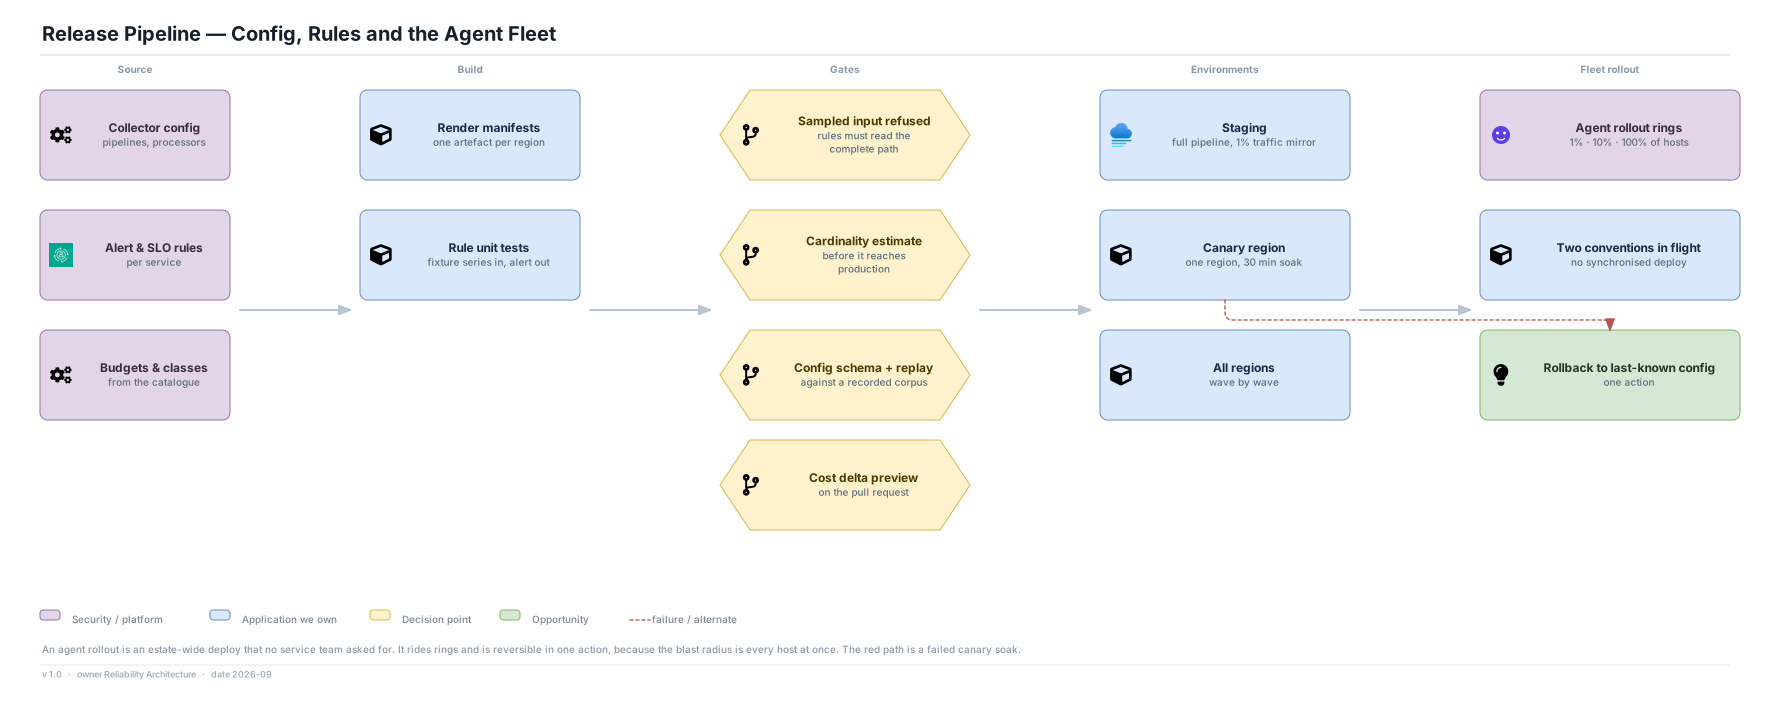
Where it runs, how it is released, how it watches itself, and the loop that keeps cardinality from becoming an outage.
19 AWS eu-west-1 — primary region, observability account Ingest VPC — spread across az-a, az-b, az-c Network Load Balancer cross-zone Gateway node group EKS, compute optimised Tail sampler node group memory optimised, 5× headroom Amazon MSK 3 AZ, 72 h retention Storage & query VPC Mimir node group EKS ClickHouse cluster EC2 i4i, S3 tiering Tempo node group EKS DynamoDB exemplar index S3 buckets hot · warm · Glacier IR · Object Lock Evaluation & control — isolated node groups, separate scaling Ruler node group no shared capacity with query Aurora PostgreSQL Multi-AZ, RPO ≤ 1 min Argo CD config as code eu-central-1 and us-east-1 — collect and store locally, replicate a reduced set Regional gateway + buffer same stack, own state Regional stores queryable from any region Reduced cross-region replica aggregates + SLO series only Amazon Managed Grafana workspace per region Separate AWS account, separate region — deliberately outside the failure domain it watches Amazon Managed Prometheus platform self-telemetry Amazon Managed Grafana the console of last resort Heartbeat canary writes and reads a probe Dead-man switch alerts on our silence Paging platform PrivateLink from every workload account no public ingest reduced set platform is blind Deployment Architecture — Three Regions and One Place That Is Not Interface / broker Security / platform Queue / topic Data store Application we own External / third party synchronous event / async failure / alternate The self-telemetry stack is managed rather than self-hosted on purpose: it must not share an EKS control plane, an account limit or an on-call engineer with the thing it is watching. v 1.0 · owner Reliability Architecture · date 2026-09 Deployment Architecture Three regions that collect and store locally, and one account deliberately outside the failure domain. HTML page SVG draw.io

Assurance

Why telemetry is treated as production data, how identity is proved on both the write and the read path, and what is assumed to fail.
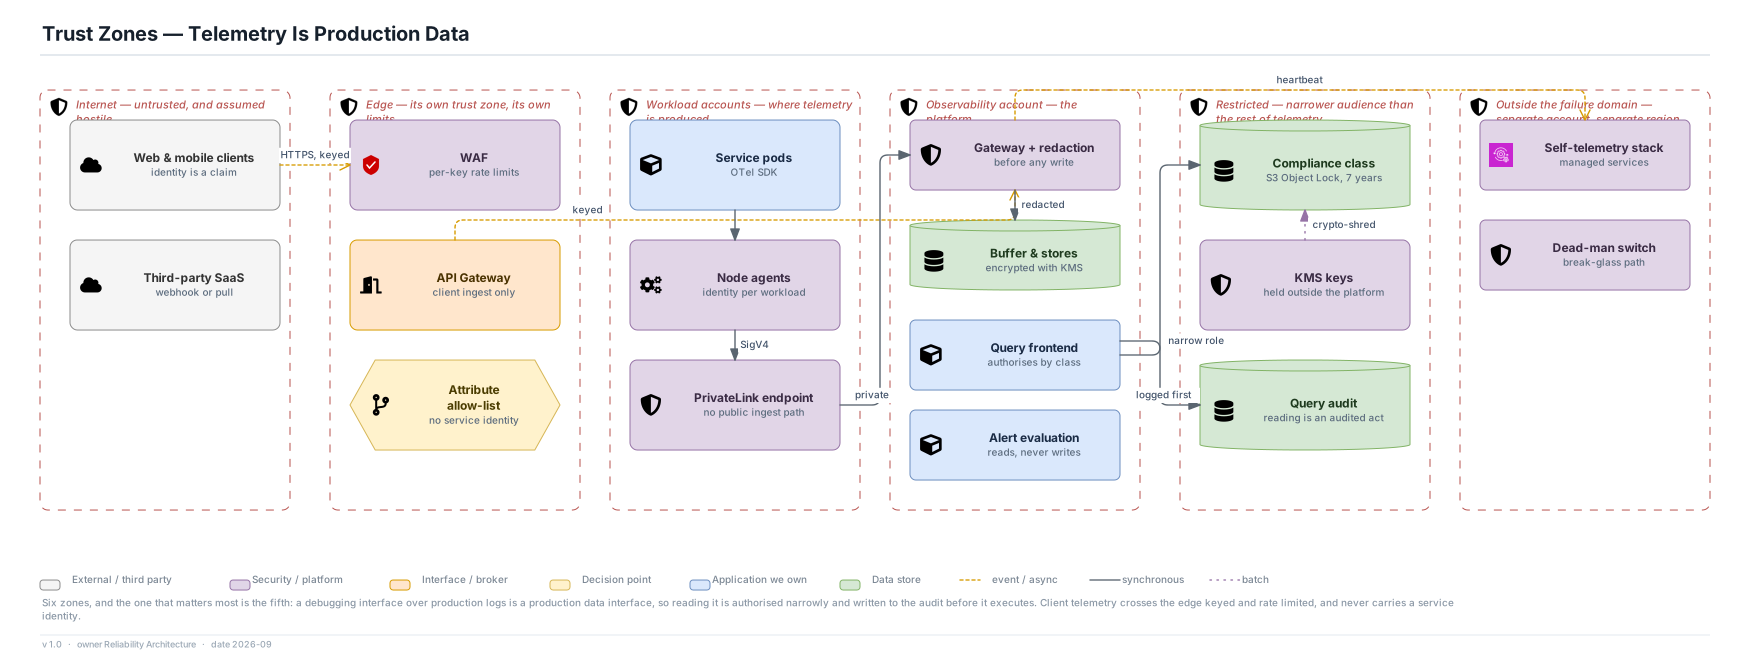
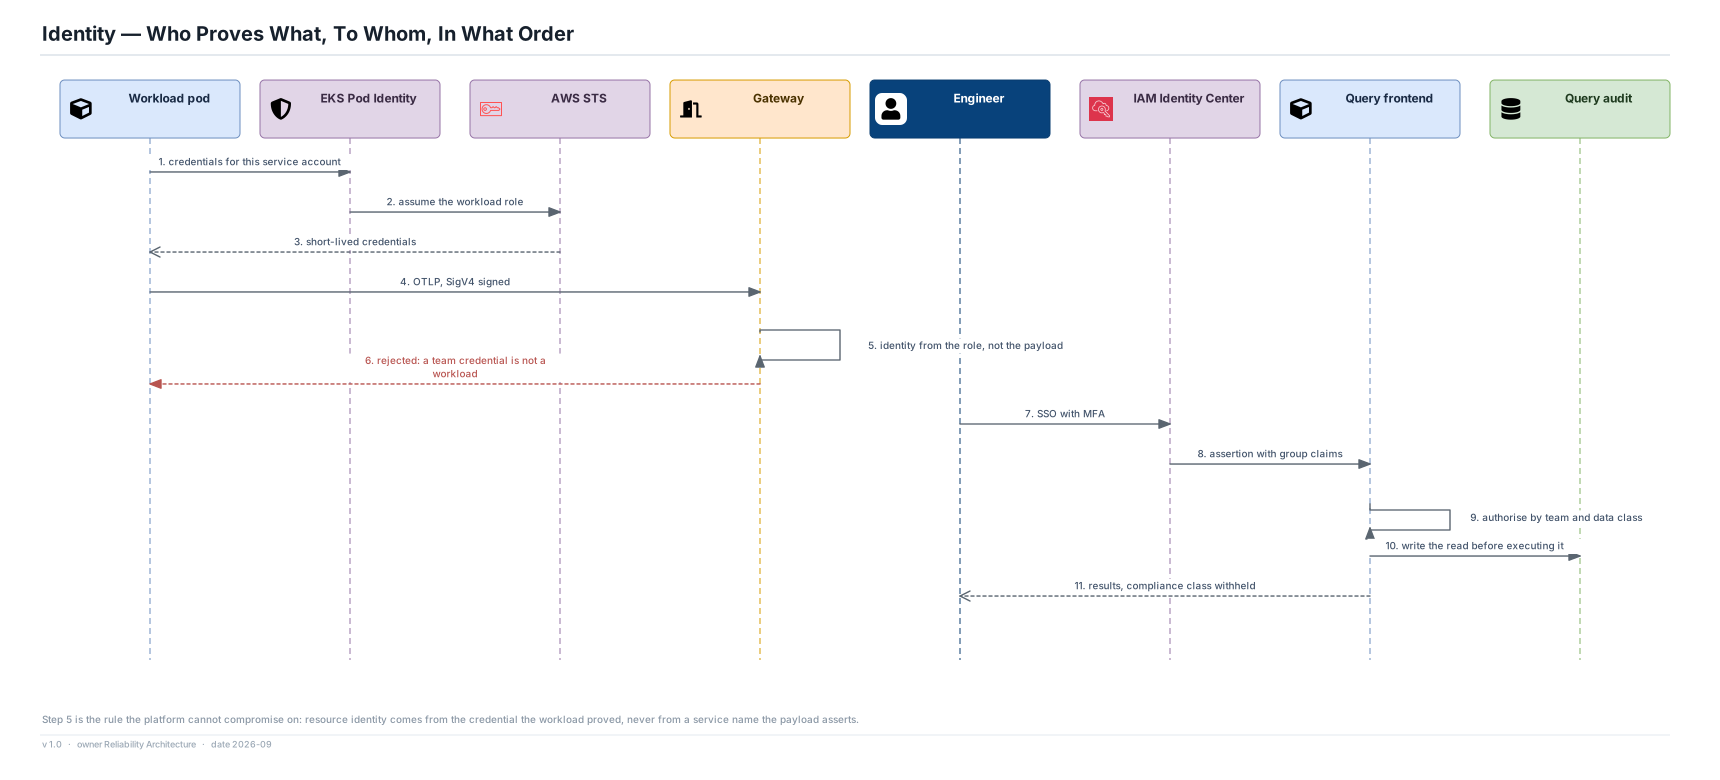
23 Internet — untrusted, and assumed hostile Web & mobile clients identity is a claim Third-party SaaS webhook or pull Edge — its own trust zone, its own limits WAF per-key rate limits API Gateway client ingest only Attribute allow-list no service identity Workload accounts — where telemetry is produced Service pods OTel SDK Node agents identity per workload PrivateLink endpoint no public ingest path Observability account — the platform Gateway + redaction before any write Buffer & stores encrypted with KMS Query frontend authorises by class Alert evaluation reads, never writes Restricted — narrower audience than the rest of telemetry Compliance class S3 Object Lock, 7 years KMS keys held outside the platform Query audit reading is an audited act Outside the failure domain — separate account, separate region Self-telemetry stack managed services Dead-man switch break-glass path HTTPS, keyed keyed SigV4 private redacted narrow role logged first crypto-shred heartbeat Trust Zones — Telemetry Is Production Data External / third party Security / platform Interface / broker Decision point Application we own Data store event / async synchronous batch Six zones, and the one that matters most is the fifth: a debugging interface over production logs is a production data interface, so reading it is authorised narrowly and written to the audit before it executes. Client telemetry crosses the edge keyed and rate limited, and never carries a service identity. v 1.0 · owner Reliability Architecture · date 2026-09 Trust Zones Six zones by decreasing exposure, and why the restricted one is the one that matters. HTML page SVG draw.io
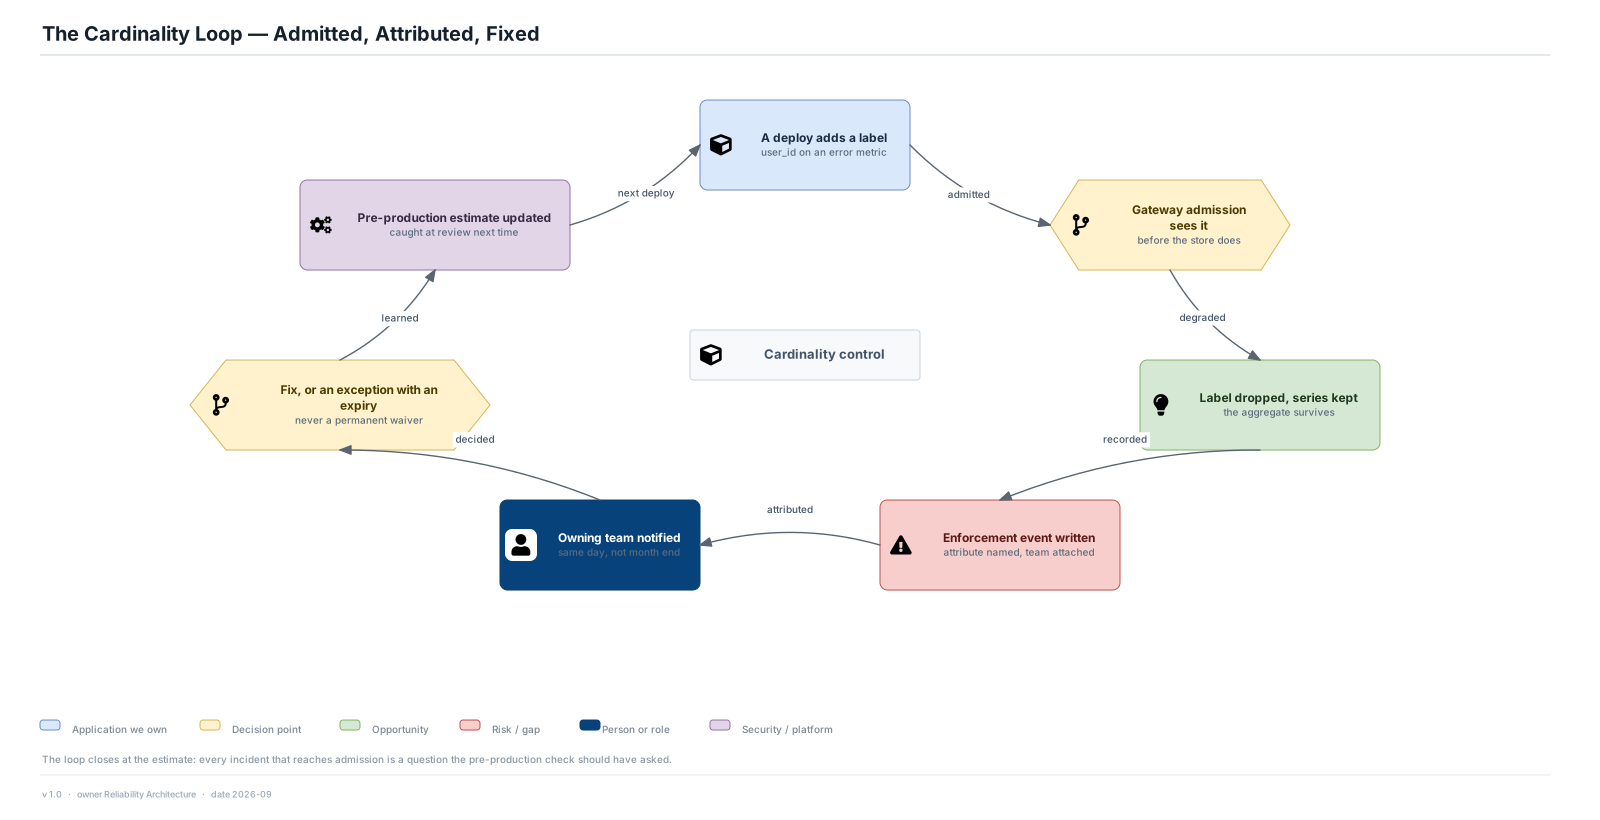
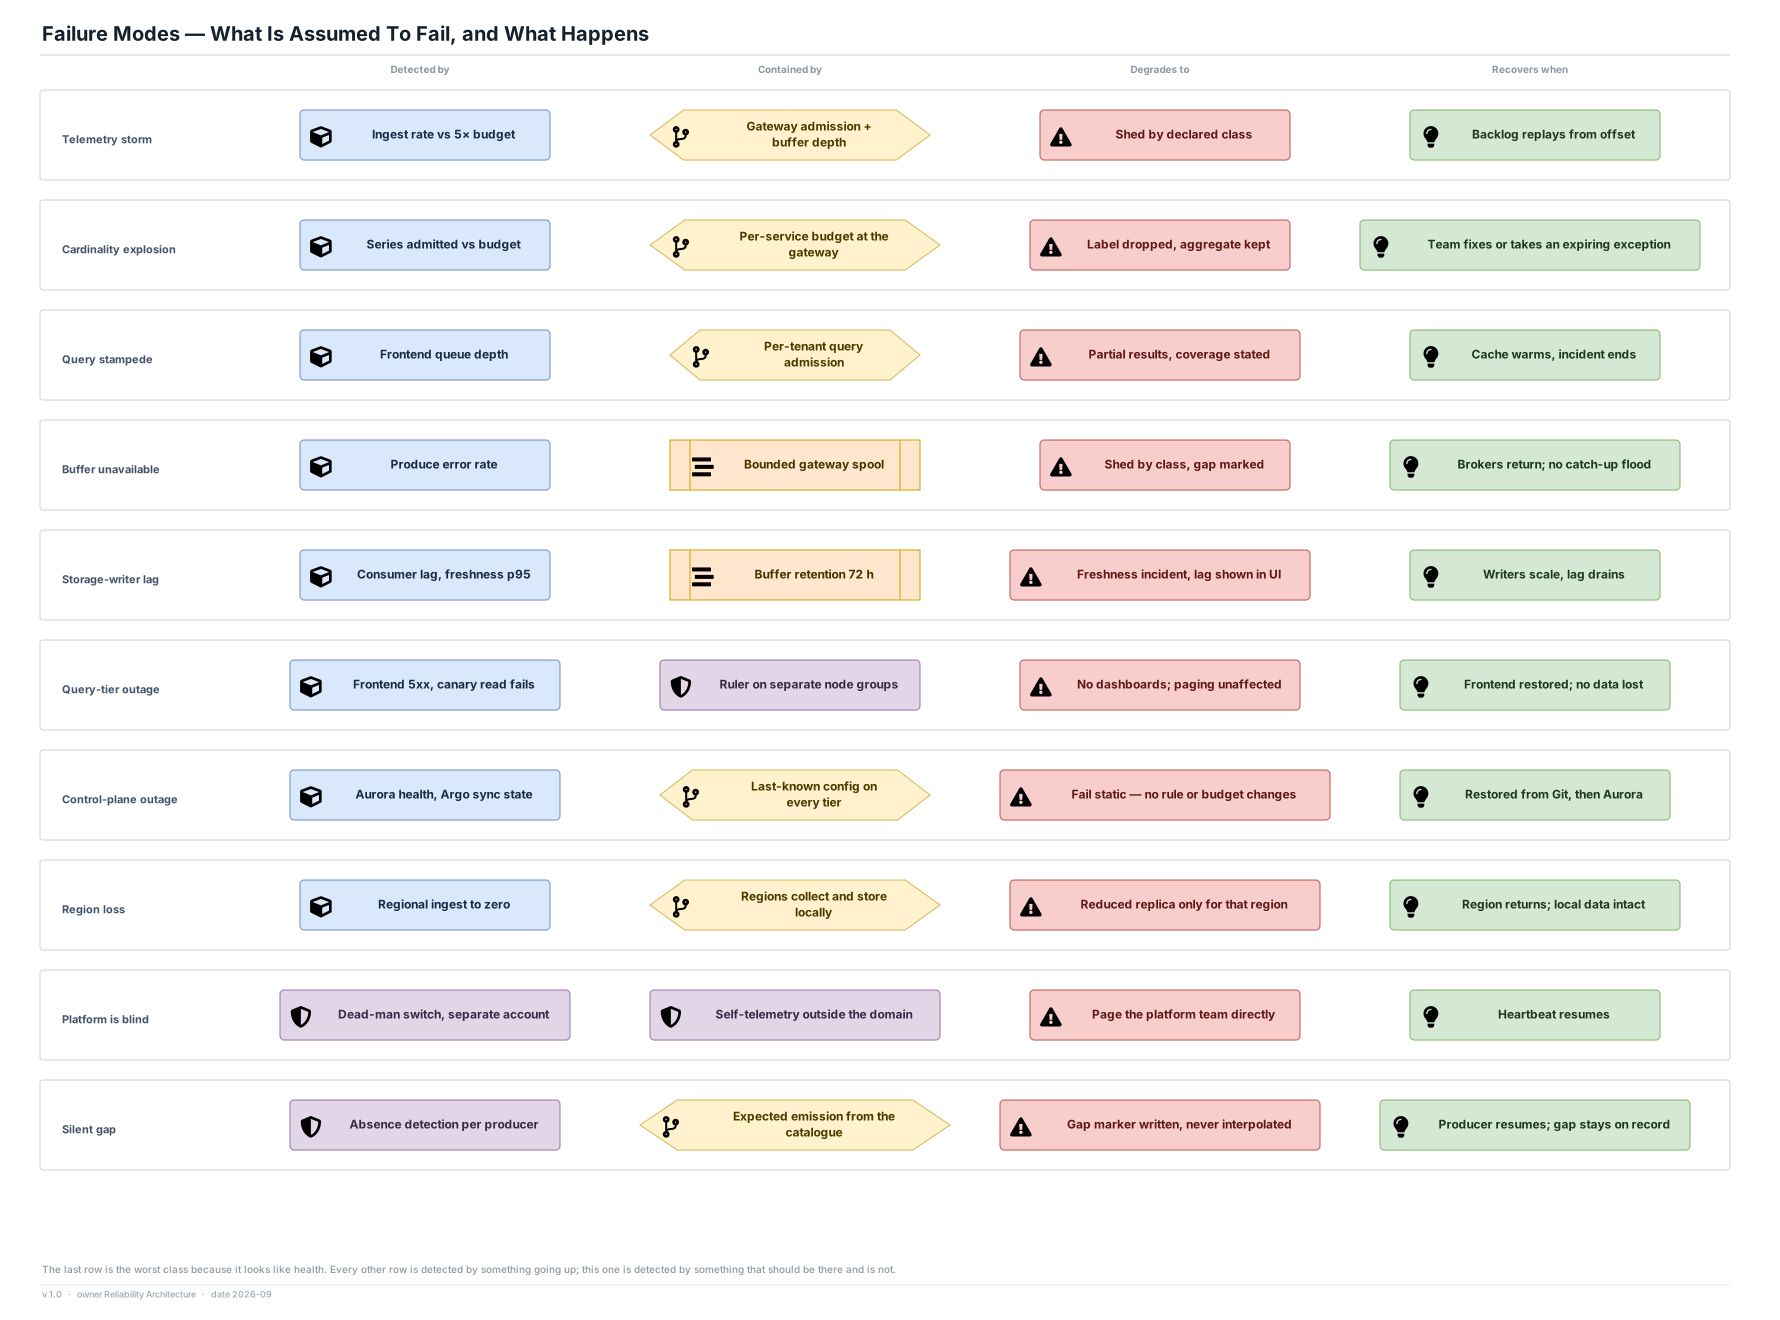
25 Detected by Contained by Degrades to Recovers when Telemetry storm Ingest rate vs 5× budget Gateway admission + buffer depth Shed by declared class Backlog replays from offset Cardinality explosion Series admitted vs budget Per-service budget at the gateway Label dropped, aggregate kept Team fixes or takes an expiring exception Query stampede Frontend queue depth Per-tenant query admission Partial results, coverage stated Cache warms, incident ends Buffer unavailable Produce error rate Bounded gateway spool Shed by class, gap marked Brokers return; no catch-up flood Storage-writer lag Consumer lag, freshness p95 Buffer retention 72 h Freshness incident, lag shown in UI Writers scale, lag drains Query-tier outage Frontend 5xx, canary read fails Ruler on separate node groups No dashboards; paging unaffected Frontend restored; no data lost Control-plane outage Aurora health, Argo sync state Last-known config on every tier Fail static — no rule or budget changes Restored from Git, then Aurora Region loss Regional ingest to zero Regions collect and store locally Reduced replica only for that region Region returns; local data intact Platform is blind Dead-man switch, separate account Self-telemetry outside the domain Page the platform team directly Heartbeat resumes Silent gap Absence detection per producer Expected emission from the catalogue Gap marker written, never interpolated Producer resumes; gap stays on record Failure Modes — What Is Assumed To Fail, and What Happens The last row is the worst class because it looks like health. Every other row is detected by something going up; this one is detected by something that should be there and is not. v 1.0 · owner Reliability Architecture · date 2026-09 Failure Modes Ten classes, each with how it is detected, contained, degraded and recovered — and one that looks like health. HTML page SVG draw.io

Architecture One-Pager

The problem, the shape of the answer, the decisions that carry it, and why it should still be right in ten years.

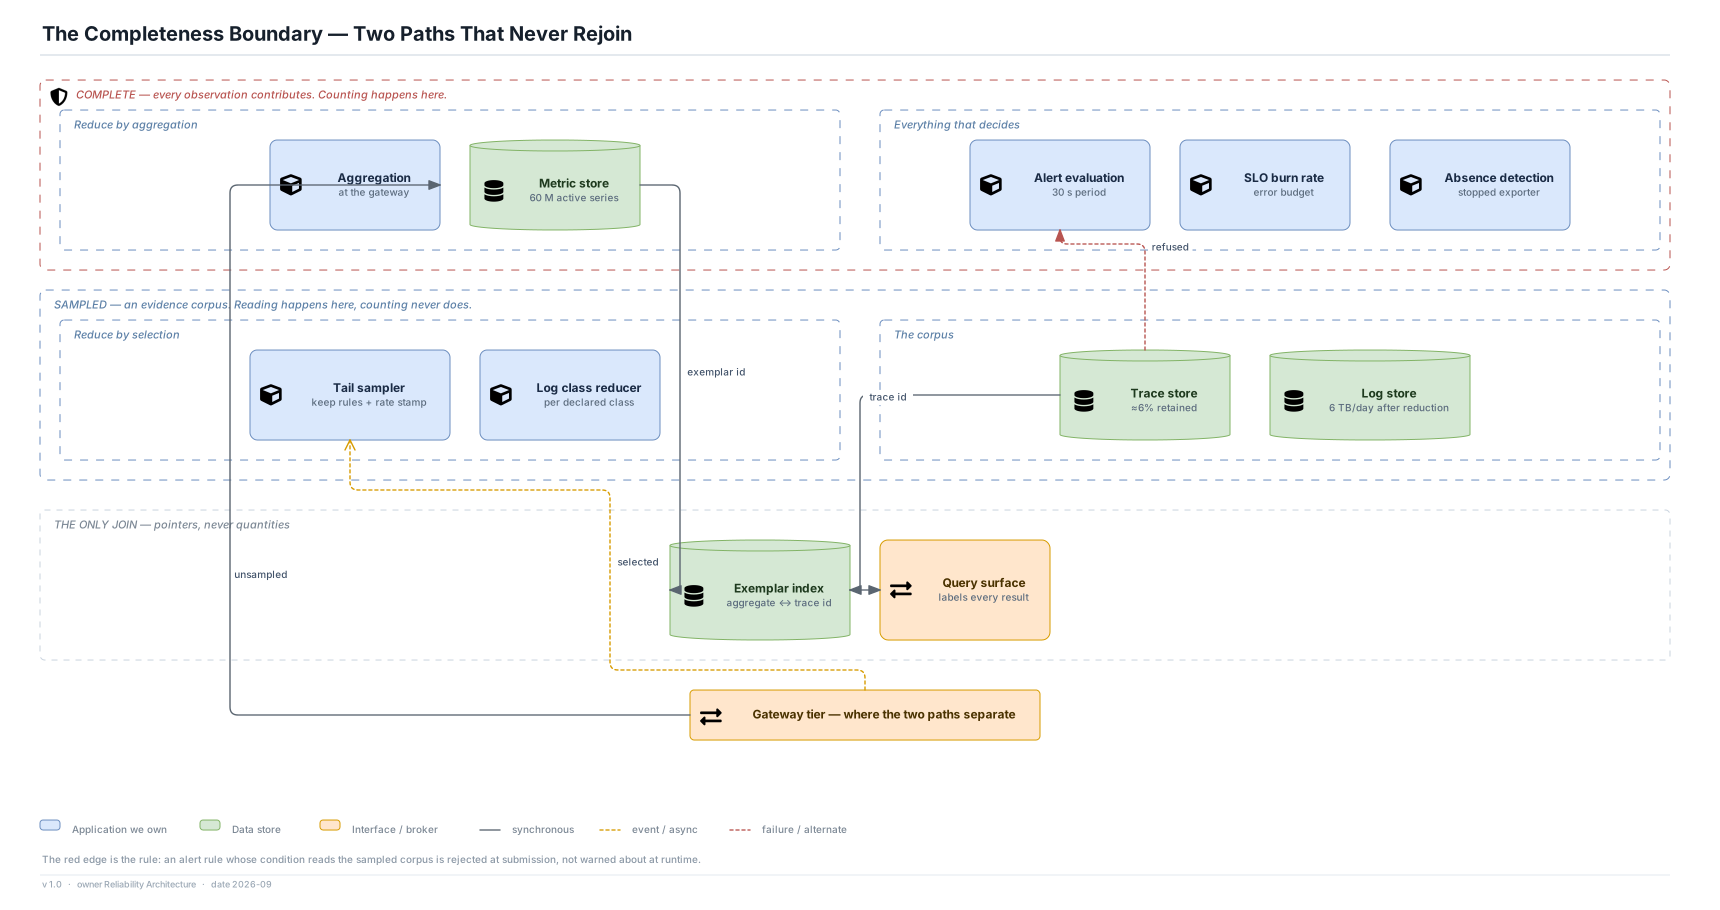
Aggregates are complete and instances are sampled. Nothing is ever counted from the sampled corpus, and every result says which side of that line it came from.

Nine hundred services across three regions produce 25 million metric samples, 1.2 million log lines and 2.5 million spans per second, and an engineer paged at 03:14 for a service they have never opened has ten minutes to name the failing component. Keeping all of it is unaffordable; sampling all of it makes every count an estimate; and the failure nobody notices — telemetry that silently stopped arriving — looks exactly like health. The platform must also survive the incidents it exists to explain, because its own load rises five- to ten-fold at precisely those moments, and it runs on the estate it is watching.

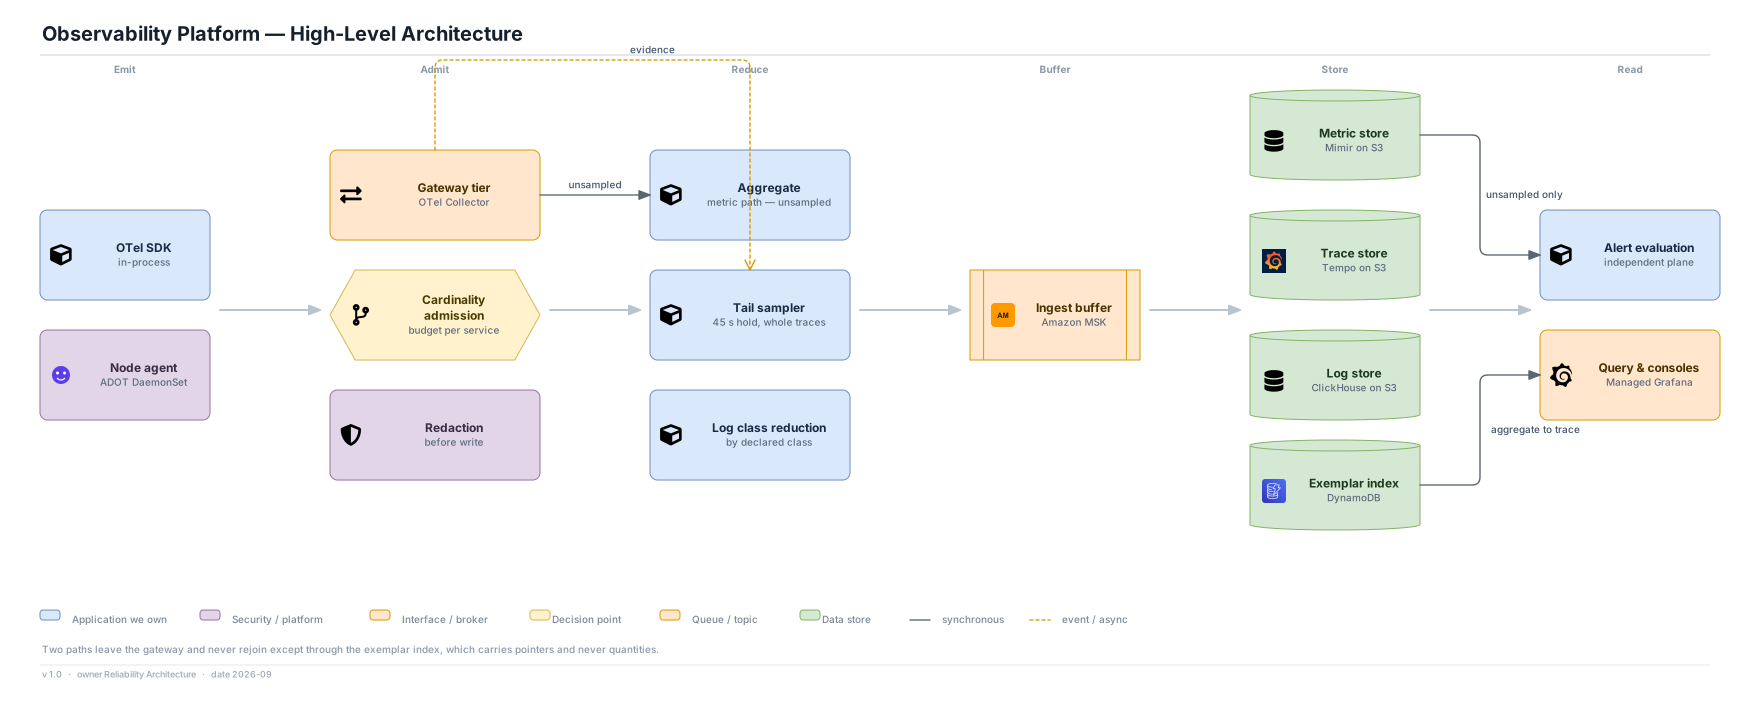
Telemetry leaves an application over localhost to a node agent that owns batching, spooling and shedding, so no application ever waits for or buffers on behalf of the platform. A gateway tier applies resource identity from the credential the workload proved, normalises, redacts before anything is durable, and enforces per-service cardinality budgets as an admission decision. There the pipeline splits: the metric path is reduced by aggregation and stays complete; the trace and log paths are reduced by selection — tail sampling with a 45-second hold and declared log classes — and are deliberately incomplete. Both write through one durable buffer, which makes every store replayable and is the only component carrying a real recovery objective. Object storage is the retention substrate for all three signals, so retention is a lifecycle rule and query capacity scales without moving data. Alert evaluation runs on its own capacity, reads the complete path directly, and cannot be stopped by a dashboard stampede. A separate account in a separate region watches the whole thing and pages when it goes quiet.

What it is, and what it is not

Complete where it is counted, sampled where it is readone corpus at one sampling rate, with every count quietly an estimate.
Cardinality admitted at the gateway, with the attribute namedcardinality discovered from the metric store's memory pressure an hour later.
A gap shown as a gap, and absence alerted as its own conditionan empty panel that reads like a healthy service.
A shed order declared before the incident and publisheddropping whatever the pipeline happens to drop when it saturates.
Alert evaluation on its own capacity, reading only complete datapaging that shares a query tier with every engineer refreshing a dashboard.
Cost attributed daily to the team whose behaviour caused ita platform bill that is nobody's problem until it is everybody's.
A witness in another account that pages when we go quieta platform that is the only judge of whether it can still see.

The decisions that are the architecture

01Split the planes at the gateway

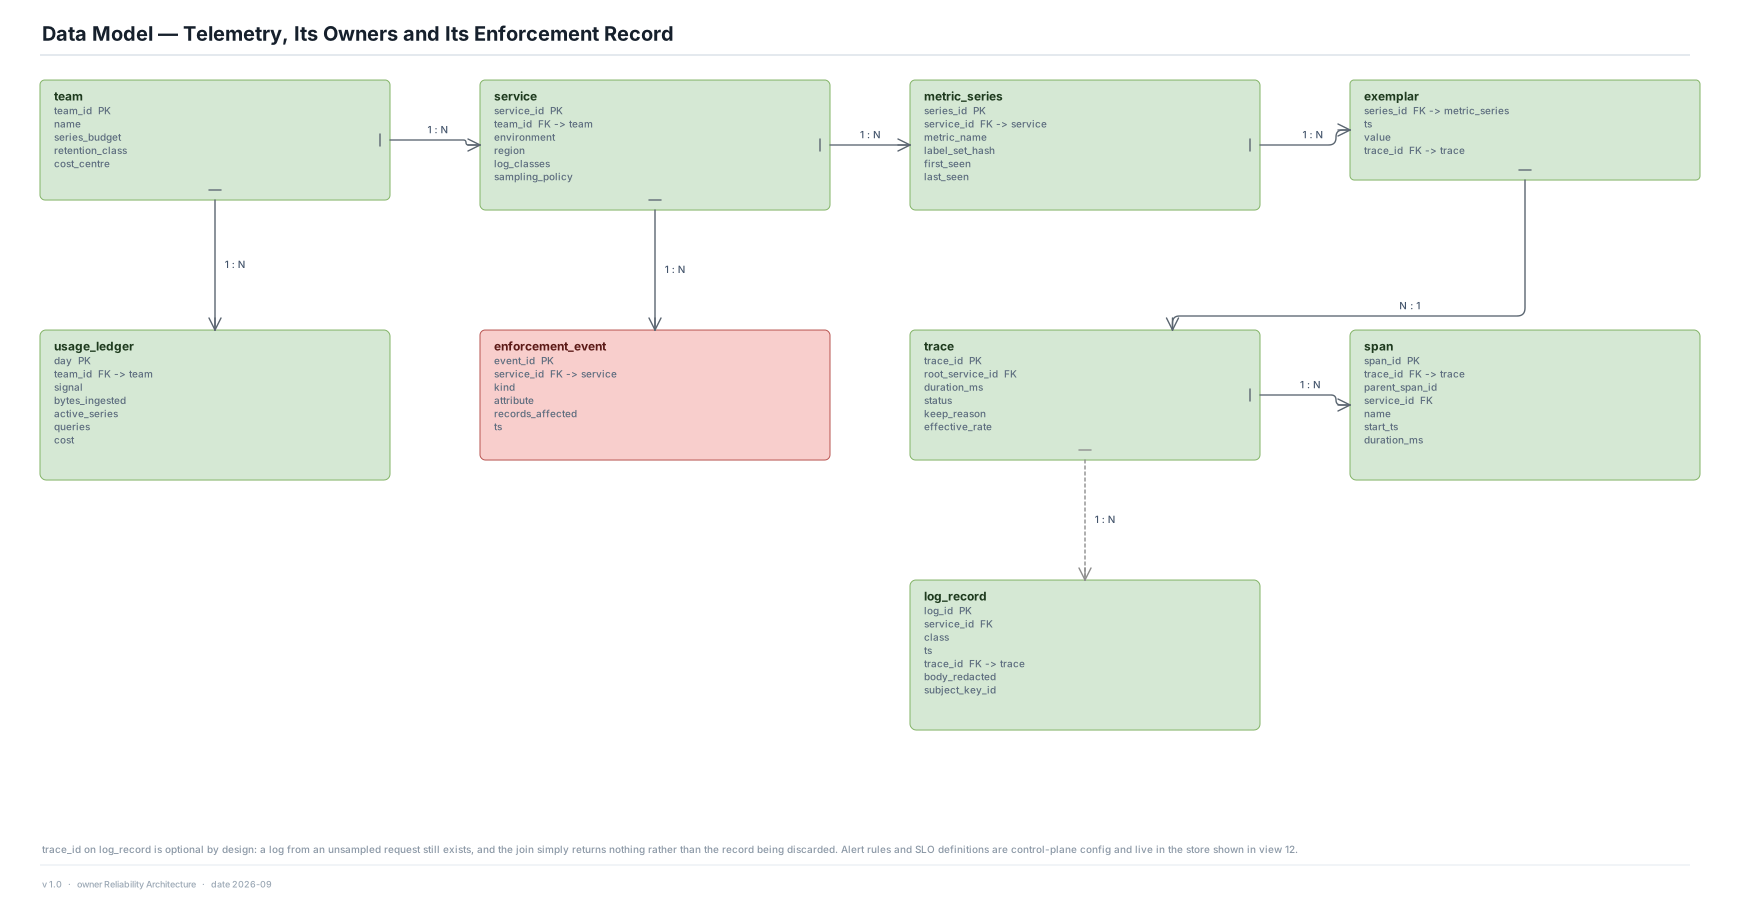
The metric path is reduced by aggregation and never sampled; traces and logs are reduced by selection and are explicitly an evidence corpus. They are joined only through an index that carries pointers and never quantities.

ADR-01

02Enforce the boundary in CI

An alert rule whose condition reads the sampled corpus is rejected when it is submitted, not warned about at runtime. The architecture's central claim is checked by a machine on every change.

ADR-03

03Admit cardinality, do not discover it

Budgets are enforced at the gateway before anything is written, a label is dropped before a series is rejected so the aggregate survives, and every action names the attribute and the owning team.

ADR-06

04Attribution follows proof

Resource identity comes from the credential the workload proved, never from the payload. Every budget, bill and access decision downstream is only as trustworthy as that one step.

ADR-05

05One buffer, one replay point

A single durable stream between admission and every writer turns a storage outage into lag rather than loss, and leaves exactly one component in the platform carrying a real RPO.

ADR-11

06Shed in a published order, never the metric path

Debug logs, then access logs, then trace rate. Counting stays true through the storm, and every shed volume is attributed to a team and shown where the data is missing.

ADR-10

07Paging does not share fate with dashboards

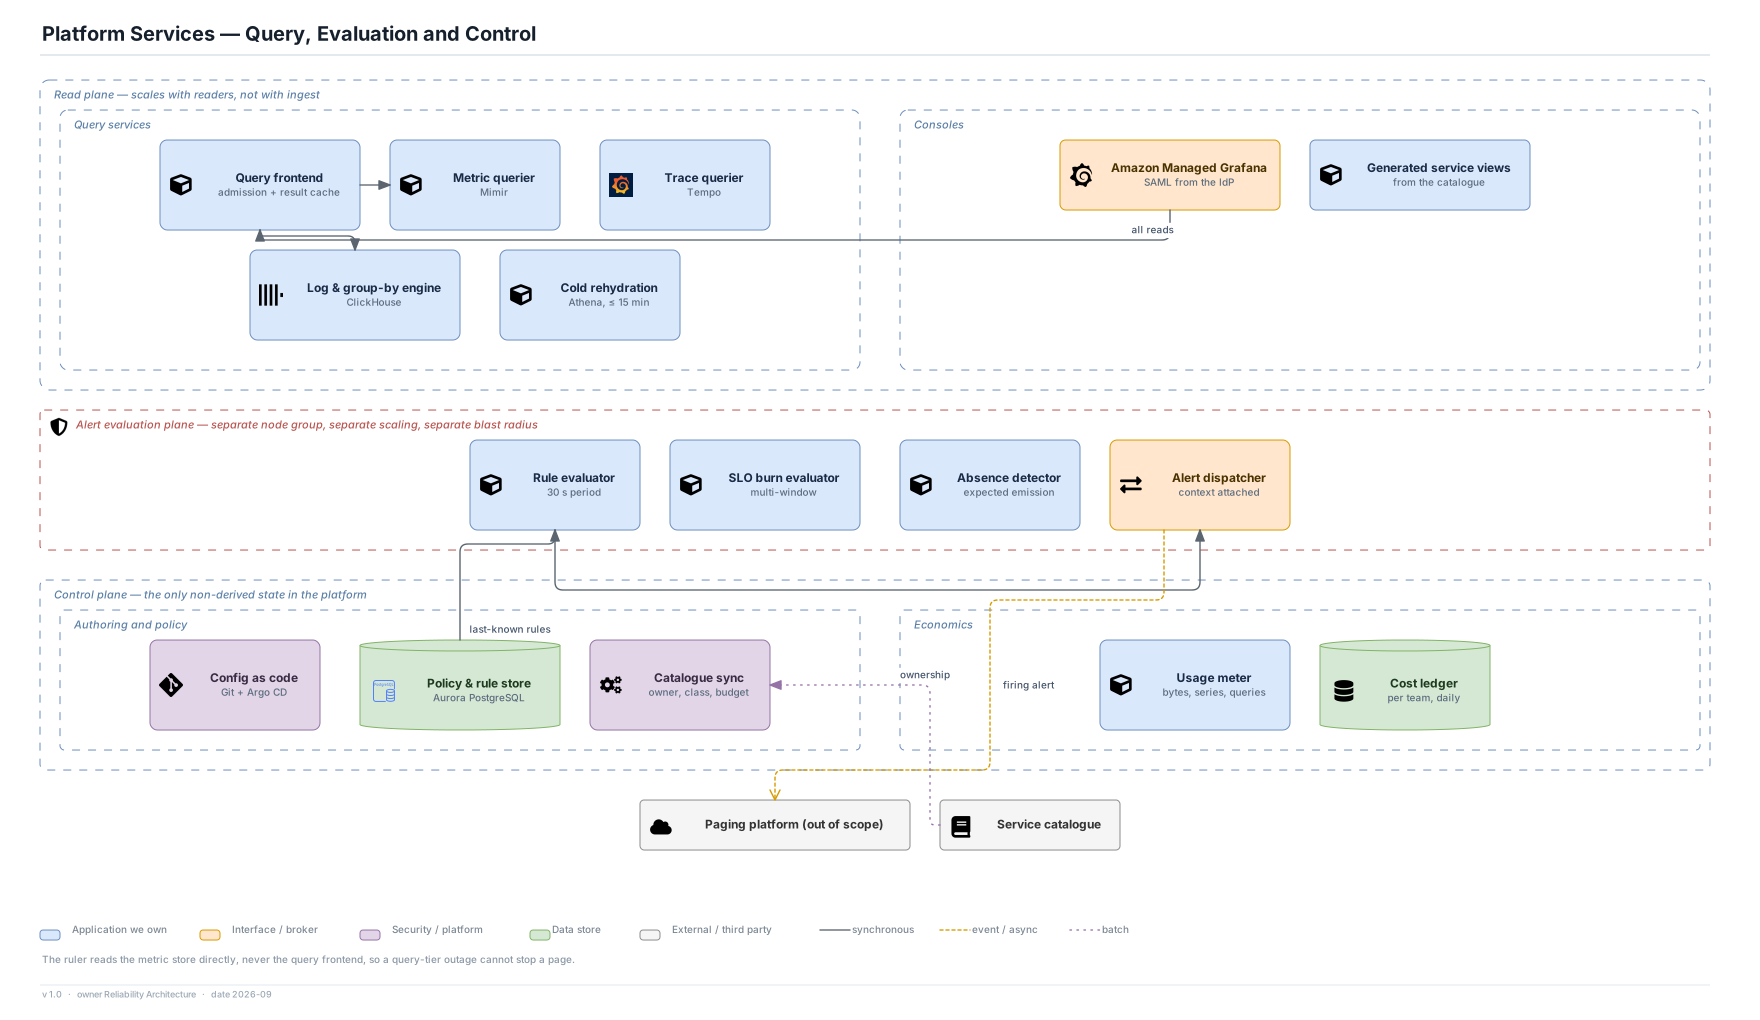
Alert evaluation runs on its own node groups and reads the metric store directly, which is what lets it carry 99.99% while interactive query carries 99.9%.

ADR-17

08Buy a witness that cannot go blind with you

A minimal self-telemetry and dead-man path in a separate account and region, on managed services, sufficient to alert that the platform itself has stopped seeing.

ADR-22

Why it holds up over time

Mimir, Tempo, ClickHouse and the collector will all be replaced. The stack in this document is the least durable thing in it. What should still be right in ten years is the set of boundaries the components sit inside.

The counting/evidence distinction is not a technology choice

Whatever stores the data, a number derived from selected records still needs the selection rate, and a platform that cannot state it is still quietly wrong. The boundary survives every migration underneath it.

Admission at the edge stays the right place for a limit

Enforce in the library and you cannot change it; enforce in the store and it fails as an outage. The middle is where you can still explain the limit to the person who caused it, and that does not move.

The load will always correlate with the incident

Every future observability platform will face a storm at exactly the wrong moment. Having the shed order written down and published before the storm is the transferable part, not the mechanism that implements it.

Separation of storage and compute keeps getting more right

Object storage economics improve relative to attached disk every year, so a design that makes retention a lifecycle rule and query a scaling decision gets cheaper over time rather than more awkward.

Attribution outlives the billing model

Whether cost is a chargeback, a quota or a central absorption in five years, the record of which team's behaviour caused which byte is the thing that makes any of those workable.

The circular dependency never goes away

An observability platform running on the estate it observes cannot be its own only witness. The answer is always somewhere with a different fate, whatever that somewhere is called next decade.

Fail static ages well

As data planes grow relative to control planes, keeping the store that holds policy out of the path that serves traffic becomes more valuable, not less.

Honesty about completeness is becoming table stakes

The pressure on every data system to state provenance and limits is increasing. A platform that already labels every result with its coverage is ahead of that, not retrofitting to it.

Non-functional targets

The requirement's targets, how this design meets each one, and the view where the mechanism is drawn. Every figure is a stated assumption for an estate of this shape, to be replaced by measurement before build.

QualityTargetHow it is metView
Metric freshness p95 ≤ 20 s, p99 ≤ 45 s Aggregation at the gateway, one buffer hop, ingester WAL before block flush 15
Trace freshness p95 ≤ 75 s, p99 ≤ 150 s Inclusive of the 45 s tail-sampling hold window, which is the whole cost of tail selection 16
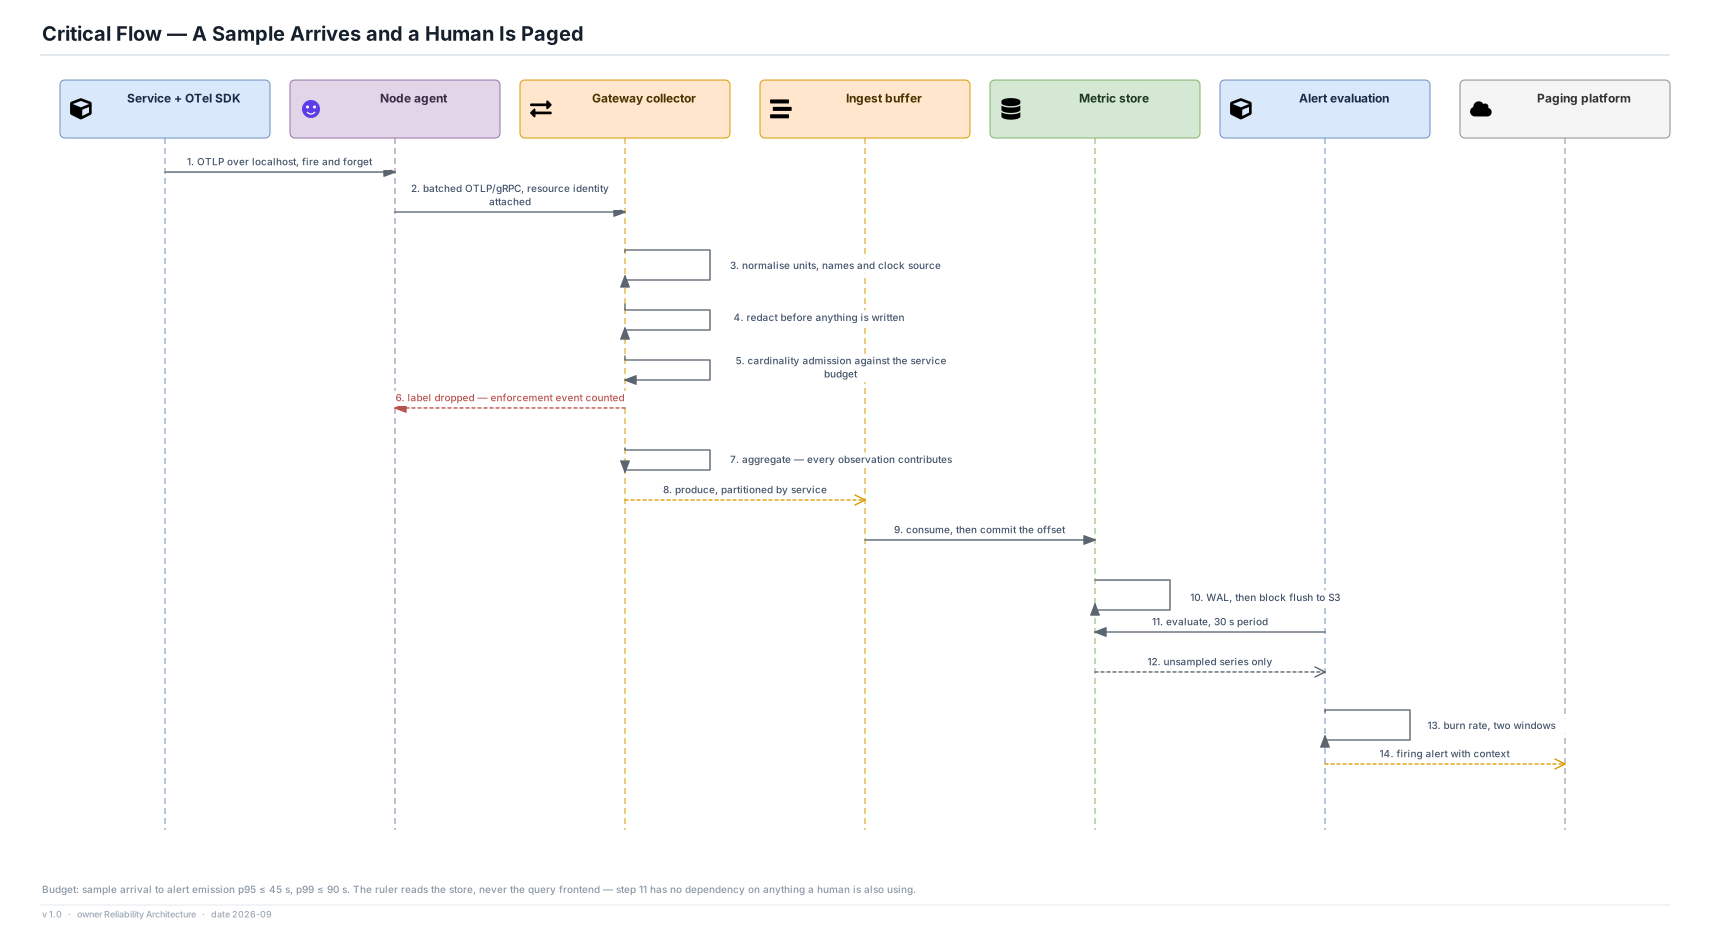
Sample to page p95 ≤ 45 s, p99 ≤ 90 s 30 s rule evaluation period on a dedicated plane reading the store directly 15
Dashboard panel, 24 h p95 ≤ 2 s, p99 ≤ 6 s Hot index plus local NVMe cache over S3 blocks; result cache in the query frontend 17
Log search, 7 days p95 ≤ 15 s, p99 ≤ 45 s ClickHouse partitions by time, service and class with a sparse index 12
High-cardinality group-by p95 ≤ 25 s, partial beyond Partial result with stated coverage rather than a timeout 17
Cold rehydration Queryable ≤ 15 min Glacier Instant Retrieval restore exposed to Athena; explicitly not an incident tool 14
Ingest availability ≥ 99.95% monthly Stateless gateways across three AZs behind a cross-zone NLB, MSK 3-AZ 19
Alert evaluation availability ≥ 99.99% monthly Own node groups, direct store reads, fail static on control-plane loss 10
Query availability ≥ 99.9% monthly Stateless queriers scaling independently of storage; cache loss is never data loss 12
Control plane availability ≥ 99.5% monthly Deliberately the weakest target: nothing serving depends on it reaching 10
Burst absorption 5× for 10 min, no loss Buffer depth plus gateway priority admission; shed by declared class beyond it 18
Cardinality ceiling 250 k series/service, 80 M global Gateway admission with label-drop degradation; store limits as a backstop 22
Buffer RPO / RTO RPO ≤ 5 min, RTO ≤ 15 min MSK three-AZ replication with 72 h retention as the replay window 12
Control plane RPO / RTO RPO ≤ 1 min, RTO ≤ 15 min Aurora Multi-AZ, with Git as an independent second copy of the same state 12
Telemetry store RPO None — derived Every store replays from the buffer within its retention; beyond it, a gap is a gap 12
Subject erasure All tiers ≤ 30 days Per-subject key derivation plus tombstone across warm and cold prefixes 14
Agent overhead ≤ 2% core, ≤ 350 MB RSS Hard resource limits; the agent sheds its own telemetry first and reports it 09
Cost ≤ $22/host/month, ≤ 4% of infra Cost per signal metered and attributed daily; unread data as the waste class 06
Self-observation ≥ 99.99% monthly AMP and AMG in a separate account and region with a round-trip canary and dead-man switch 19

Scope

In scope

  • Collection of metrics, logs and traces from 900 services, 12,000 hosts and the managed AWS estate
  • Admission: resource identity, normalisation, redaction and per-service cardinality budgets
  • Reduction: metric aggregation, head and tail sampling, log class reduction, and the published shed order
  • Storage: one durable buffer, three signal stores, the exemplar index, and five retention tiers on object storage
  • Query: one surface across the three signals, the aggregate-to-instance pivot, and completeness on every result
  • Alert and SLO evaluation on an isolated plane, including absence detection, up to the point of emission
  • Tenancy, onboarding from the service catalogue, cost attribution and per-team scorecards
  • Self-telemetry and meta-alerting from outside the platform's own failure domain

Explicitly out of scope

  • Incident response: routing, escalation, on-call schedules and acknowledgement, which belong to the paging platform
  • Product analytics, which belongs in the warehouse and makes an operational store slow and expensive
  • The regulatory audit log, whose custody requirements this platform deliberately does not offer
  • Automated remediation or any action taken on the estate as a result of what is observed
  • Business-level dashboards and reporting built on telemetry, which are consumers rather than platform

Prove it before production depends on it

Ten weeks, one region, forty services across six teams and about 900 hosts, with the aim of falsifying the four assumptions that would change the architecture rather than demonstrating that the pipeline runs.

  1. Measure the tail sampler's memory at the real offered span rate and at 5× it, and establish whether 45 seconds covers p99.9 of in-house request duration or whether the window has to grow
  2. Run the cardinality admission processor in shadow mode against real production traffic for four weeks and count how many services would have been degraded or rejected, and on which attributes
  3. Time the aggregate-to-trace-to-log pivot end to end with engineers who have not seen the service, and record how often the exemplar is missing
  4. Replay a recorded incident's telemetry at 5× and confirm the shed order behaves as published, that counts stay true, and that the gap markers reach the query results
  5. Measure the real cost per signal against the $22 per host per month target, split by ingest, retention tier, query and evaluation
  6. Kill the query tier during a live investigation and confirm that alert evaluation is unaffected and that missed evaluations remain zero
  • Pass: tail sampler memory within the provisioned envelope at 5× burst, cardinality shadow-mode degradations under 2% of services, pivot success rate above 90% on error traces, counts provably unchanged through a replayed storm, and cost per host within 25% of target.
  • Redesign the sampler: if the 45-second window does not cover p99.9 of request duration, or memory at 5× exceeds what is affordable, move to storage-based selection (ADR-08's deferred option) before building anything else on top of it.
  • Reopen ADR-13: if cold rehydration is requested fewer than three times in ten weeks and no audit need appears, downsample-and-discard becomes the default and the 400-day raw log tier is dropped from the MVP.

Open risks, carried rather than hidden

RiskIf it landsResponse
Log classes are never declared in earnest The shed order in ADR-10 degenerates to shedding at random with extra ceremony, and the storm response is worse than useless Classification is part of catalogue onboarding with platform defaults; undeclared services are named on the scorecard; the prototype measures declaration rate as a pass criterion
The self-telemetry account is cut in a cost review The circular dependency is unanswered and the platform can be blind while reporting itself healthy It is a named line item with its own justification in ADR-22, sized to be small, and the dead-man switch is listed as a control rather than as infrastructure
The ruler's dedicated capacity is merged back into the query tier The 99.99% alerting target silently becomes the query tier's 99.9%, and nobody notices until a page does not arrive The isolation is stated as the mechanism behind a specific availability target, and missed evaluations are reported to the independent witness account
Cardinality exceptions become permanent The budget stops being a control and the metric store's cost grows without a ceiling Every exception carries an expiry; expired exceptions appear on the scorecard; the global ceiling is enforced independently of per-service budgets
Absence alerts are tuned down for noise The failure class that looks like health loses its only detector Absence suppression requires an expiring recorded justification, and suppression rate is itself reported
Soft quotas are ignored and spend keeps rising The organisation ends up imposing hard quotas reactively, during a budget crisis rather than by design ADR-19 names the conditions that would flip the decision; cost per host and percentage of infrastructure spend are published monthly against the target

Architecture Decision Record

Why every component and every technology on these 25 views is what it is, and what each choice costs.

Twenty-four decisions make up this architecture. Everything else across the twenty-five views is convention, sizing or consequence. Each record states the forcing question, the context that makes it hard, what was decided, how it is realised on AWS, the options weighed, what the choice buys and costs, the conditions that would flip it, why it should still be right in ten years, and the lesson that transfers beyond this platform.

Status of this document. This is a design, not a report on a running system. The rates, latencies, volumes, retentions and costs are the requirement's stated assumptions for a 900-service consumer SaaS estate across three AWS regions, invented to be defensible and arguable rather than absent. They are to be replaced by measured telemetry before build, and several of them — the 45-second tail-sampling hold window, the 400-day cold log tier and the $22 per host per month target — are explicitly the first numbers that real data should overturn.

How to read a record

QuestionThe forcing question: why a decision was needed at all.
ContextThe requirement, the scale and the constraint that make it hard.
DecisionWhat this architecture does, stated so it can be checked.
How it is realised on AWSThe concrete mechanism: which service or package, configured how, in which account.
Options weighedChosen, rejected, deferred, or right elsewhere, with the reason for each.
ConsequencesWhat the choice buys and what it costs, both kept visible.
Choose differently whenThe conditions that would flip the decision for your system.
Why it holds up over timeWhat keeps the decision right as scale, staff and technology change.
LessonThe principle that transfers beyond this platform.

Decision map

The completeness boundary 3

The one decision that defines this architecture: which data is complete, which is a sample, and what is allowed to read each.

ADR-01Aggregates are complete and instances are sampled, and the split is enforced in the pipeline ADR-02The exemplar index is the only join between the planes, and it carries pointers, never quantities ADR-03An alert rule that reads the sampled corpus is refused at submission

Collection and admission 4

How telemetry leaves a process, who says what it is, and where the platform is allowed to say no.

ADR-04A node agent collects; the application never holds a durable buffer and never retries to a remote endpoint ADR-05Resource identity comes from the credential the workload proved, never from the payload ADR-06Cardinality is admitted at the gateway, and a label is dropped before a series is rejected ADR-07Redaction happens before the first write, and every redaction is counted

Reduction and sampling 3

What is discarded, under what rule, and how the reader finds out.

ADR-08Tail sampling with a 45-second hold, whole traces only, sharded by trace identifier ADR-09Log reduction is by declared class, not by a global rate ADR-10The shed order is declared in advance, and the metric path is not in it

Storage and retention 4

The replay point, the substrate, the tiers, and the one class that outlives the rest.

ADR-11One durable buffer between admission and every writer is the platform's single replay point ADR-12Object storage is the retention substrate; query capacity scales without moving data ADR-13Cold data is kept raw and rehydrated, rather than downsampled and discarded ADR-14The compliance class is separable, with its own retention, its own audience and keys held outside the platform

Query and correlation 2

How three very different stores answer one investigation, and what every answer must admit about itself.

ADR-15Three signal-specific stores behind one query surface, rather than one engine over one store ADR-16Every result states its completeness, and a partial answer beats a timeout

Alerting and evaluation 2

The plane that pages a human, what it is allowed to read, and the failure that looks like health.

ADR-17Alert evaluation runs on its own capacity and reads the store directly ADR-18Absence of signal is a first-class alert condition, driven by expected emission

Economics and governance 3

Who pays, who decides, and what the platform is allowed to refuse.

ADR-19Chargeback with soft quotas, and a hard quota only on cardinality ADR-20Query cost is charged to the reader, and unread data is the headline waste class ADR-21The service catalogue is the front door, and an unclaimed producer is quarantined

Operations and assurance 3

Running a platform that depends on the estate it observes, and releasing to 12,000 hosts nobody asked.

ADR-22Self-telemetry runs in a separate account and region, on managed services ADR-23Config, rules and budgets are code with gates; agent rollouts ride rings ADR-24Every plane fails static on control-plane loss, and never fails silent

Technology by capability

Every capability on the views, the service or package that provides it, a credible alternative, and the record that justifies the choice. The platform runs on Amazon Web Services with open-source collection and storage; managed services are used where they remove operational load without removing the per-tenant control this estate needs, and self-managed components are used where they do not.

Open source This design
CapabilityChoiceOriginCredible alternativeWhy this oneRecord
Instrumentation OpenTelemetry SDKs Open source Vendor agent libraries No proprietary library in 900 services ADR-04
Node collection ADOT Collector (DaemonSet / systemd) AWS distribution of OTel Direct SDK export; per-pod sidecar One implementation of batching, spooling and shedding ADR-04
Admission & reduction OTel Collector gateway on EKS Open source Store-side limits Updatable in seconds, before anything is written ADR-06
Redaction Collector processor, versioned patterns This design Read-time masking Nothing unredacted is ever durable ADR-07
Trace selection Tail-sampling processor + load-balancing exporter Open source Head sampling only Keeps the traces that are worth keeping ADR-08
Ingest buffer Amazon MSK, 72 h retention AWS managed Kinesis Data Streams; direct writes Storage outages become lag, not loss ADR-11
Metric store Grafana Mimir on S3 Open source Amazon Managed Prometheus Per-tenant cardinality limits and cost control ADR-15
Trace store Grafana Tempo on S3 Open source AWS X-Ray Object-store substrate, trace-by-id at low cost ADR-12
Log store & group-by ClickHouse with S3 tiering Open source Amazon OpenSearch; Loki High-cardinality group-by over raw attributes ADR-15
Exemplar index DynamoDB, 90-day TTL AWS managed Attribute join at query time Small, hot, and structurally pointer-only ADR-02
Retention substrate S3 Standard / Glacier IR / Object Lock AWS managed Cluster-local disks Retention is a lifecycle rule, not a migration ADR-12
Cold query Amazon Athena over rehydrated partitions AWS managed Downsample and discard Unanticipated questions stay answerable ADR-13
Alert evaluation Mimir ruler, dedicated node group Open source Evaluate through the query frontend A query-tier outage cannot stop a page ADR-17
Absence detection Expected-emission rule groups This design Per-service rules by teams Catches the failure that looks like health ADR-18
Consoles Amazon Managed Grafana AWS managed Self-hosted Grafana Removes an availability dependency worth nothing to own ADR-15
Query admission & coverage Query frontend (built) This design Direct store access per signal One coverage statement, one admission policy ADR-16
Workload identity EKS Pod Identity · IAM Roles Anywhere · SigV4 AWS managed mTLS with SPIFFE; shared API keys Attribution follows proof, not assertion ADR-05
Human identity IAM Identity Center (SAML, MFA) AWS managed Per-tool local accounts Authority from group membership ADR-14
Control plane store Aurora PostgreSQL Multi-AZ + Git AWS managed + open source Config in the metric store The only non-derived state, held twice ADR-24
Config delivery Git + Argo CD, ringed agent rollout Open source Console editing with an audit log Review, test and revert for configuration ADR-23
Cost attribution Usage meter + ledger, reconciled to CUR This design Central absorption The cost lands where the behaviour is ADR-20
Self-telemetry AMP + AMG in a separate account and region AWS managed Self-monitor in-platform A witness that cannot go blind with us ADR-22
Private ingest path PrivateLink from workload accounts AWS managed Public endpoint with authentication No public ingest path for in-house telemetry ADR-05
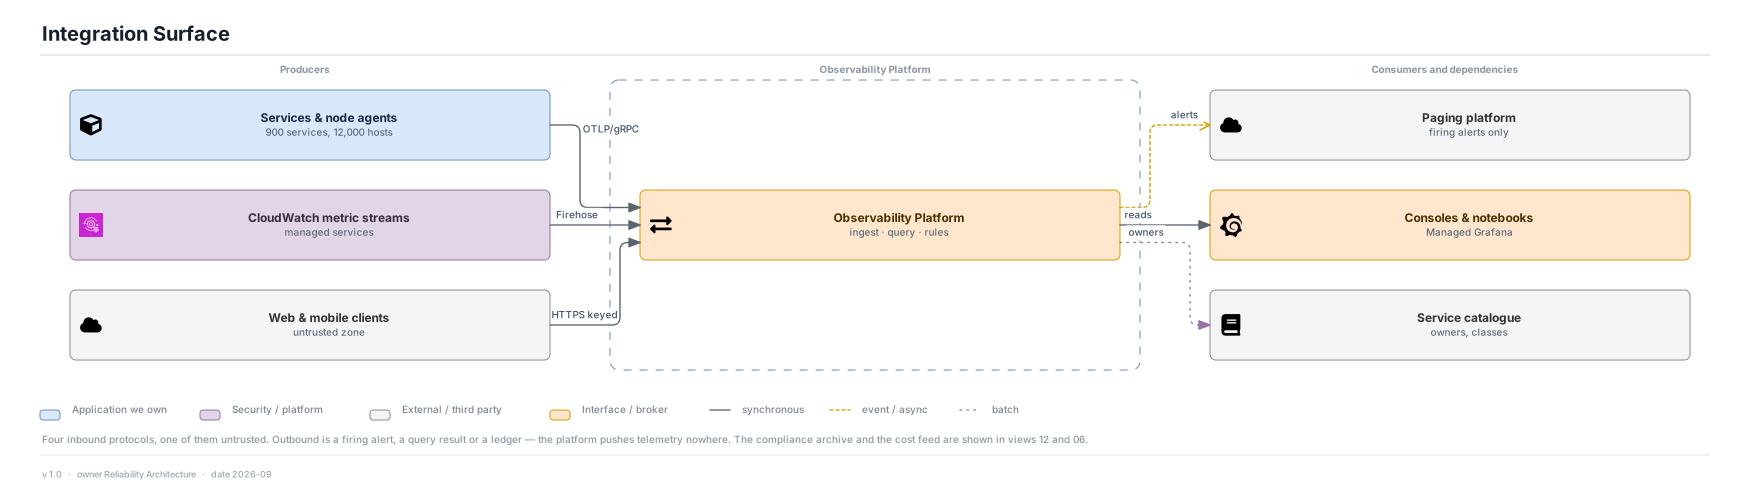
Untrusted client ingest WAF + API Gateway, keyed and allow-listed AWS managed Same endpoint as services A client can never resolve to a service identity ADR-05

The decisions, and the alternatives that lost

The completeness boundaryThe one decision that defines this architecture: which data is complete, which is a sample, and what is allowed to read each.

ADR-01

Aggregates are complete and instances are sampled, and the split is enforced in the pipeline

Accepted

Which telemetry may be trusted to answer "how many", and which is only evidence of "what happened to this one"?

Context
An observability platform is asked two different questions with the same interface. "What is the error rate" is a counting question, and an answer that is off by the sampling rate is worse than no answer because it looks plausible. "Why did this request fail" is an evidence question, and a corpus containing the interesting cases answers it perfectly well while containing 6% of the traffic. Conflating the two is the standard failure: a team computes a count from a sampled trace corpus, is wrong by a factor of sixteen, and has no way to know. At 25 million samples per second against 2.5 million offered spans per second, keeping everything unsampled is not affordable, and sampling everything makes every count an estimate.
Decision
The metric path is never sampled. It is reduced by aggregation, in which every observation contributes before anything is discarded, and it is the only source for counting, rates, percentiles and alerting. The trace and log paths are reduced by selection and are explicitly incomplete. The two paths separate at the gateway, are written to separate stores, and are joined only through the exemplar index. Every retained trace carries the effective sampling rate that produced it, and the query surface refuses or corrects any count derived from the sampled corpus.
How it is realised on AWS
The OTel Collector gateway runs two pipelines from one receiver set: a metrics pipeline whose last processor is aggregation into Mimir-bound series, and a traces/logs pipeline that exports through a load-balancing exporter to the tail-sampling shards. They share no processor after the admission stage. The effective rate is written as a span attribute at the sampler and carried into Tempo.
Options weighed
  • ChosenTwo paths, complete metrics and a sampled evidence corpus: Counting stays true at any sampling rate. Costs a second pipeline and a correlation index.
  • right elsewhereOne wide-event corpus, metrics derived from it: Materially better at unanticipated questions because raw attributes survive. Requires accepting that every count is an estimate, or retaining enough unsampled that the saving disappears.
  • RejectedSample everything at one rate and scale up the numbers: Cheapest. Rare events — the ones that matter — are exactly where scaling up is least reliable, and error counts become unusable.
  • RejectedKeep everything, sample nothing: Perfect fidelity at roughly 16× the trace storage and ingest cost, for a corpus that is almost entirely successful requests nobody reads.
Consequences
What it buys
  • Every count, rate and percentile in the platform is true for all of the traffic
  • The trace retention rate becomes a cost lever with no correctness consequence
  • Alerting can be isolated from the query tier because it reads only one plane
What it costs
  • Two pipelines, two reduction policies and an index to join them
  • "Group errors by customer id" is answerable only on the sampled corpus, with a coverage caveat
  • Every engineer has to learn which side of the line their question is on
Choose differently when
If the estate's traffic were small enough to retain unsampled — roughly two orders of magnitude below this one — the wide-event design wins outright, because the boundary buys nothing and the raw attributes answer more questions.
Why it holds up over time
Storage gets cheaper and sampling gets smarter, but the distinction between a measurement and a specimen does not move. Whatever replaces Mimir and Tempo, a count computed from selected records will still need the selection rate, and a platform that cannot state it will still be quietly wrong.
LessonDecide once, in the pipeline, which data is allowed to be counted. Leaving it to the query author means being wrong occasionally and never knowing which time.
Shown on views08 02 16
ADR-02

The exemplar index is the only join between the planes, and it carries pointers, never quantities

Accepted

If the complete and sampled planes are separate, how does an engineer get from a spike on a chart to the request behind it?

Context
The boundary in ADR-01 is only tolerable if crossing it is easy. Without a join, an engineer sees a spike and then searches the trace store by hand for something that might correspond to it — which is the manual step that makes people give up and go back to grepping logs. But any join is also a route by which the sampled corpus can leak back into a count: an index that stores how many traces matched would immediately be read as a count, and it would be wrong.
Decision
Latency and error metrics carry exemplars: a trace identifier sampled from the requests behind each aggregate bucket. The exemplar index holds series identifier, timestamp, value and trace identifier, and nothing else. It answers "show me one of these" and cannot answer "how many of these". When no exemplar exists for a bucket, the platform says the evidence was not kept rather than returning an empty result.
How it is realised on AWS
Exemplars are emitted by the SDK and preserved through the collector's aggregation processor, written to DynamoDB keyed on series identifier and time bucket with a 90-day TTL. Grafana's exemplar support renders them as points on the chart; clicking one resolves a Tempo trace by identifier.
Options weighed
  • ChosenExemplar index of pointers only: One click from aggregate to instance, and structurally incapable of being mistaken for a count.
  • RejectedShared attribute keys and a query-time join: No extra store. Requires the same high-cardinality attributes on both planes, which defeats the cardinality budget.
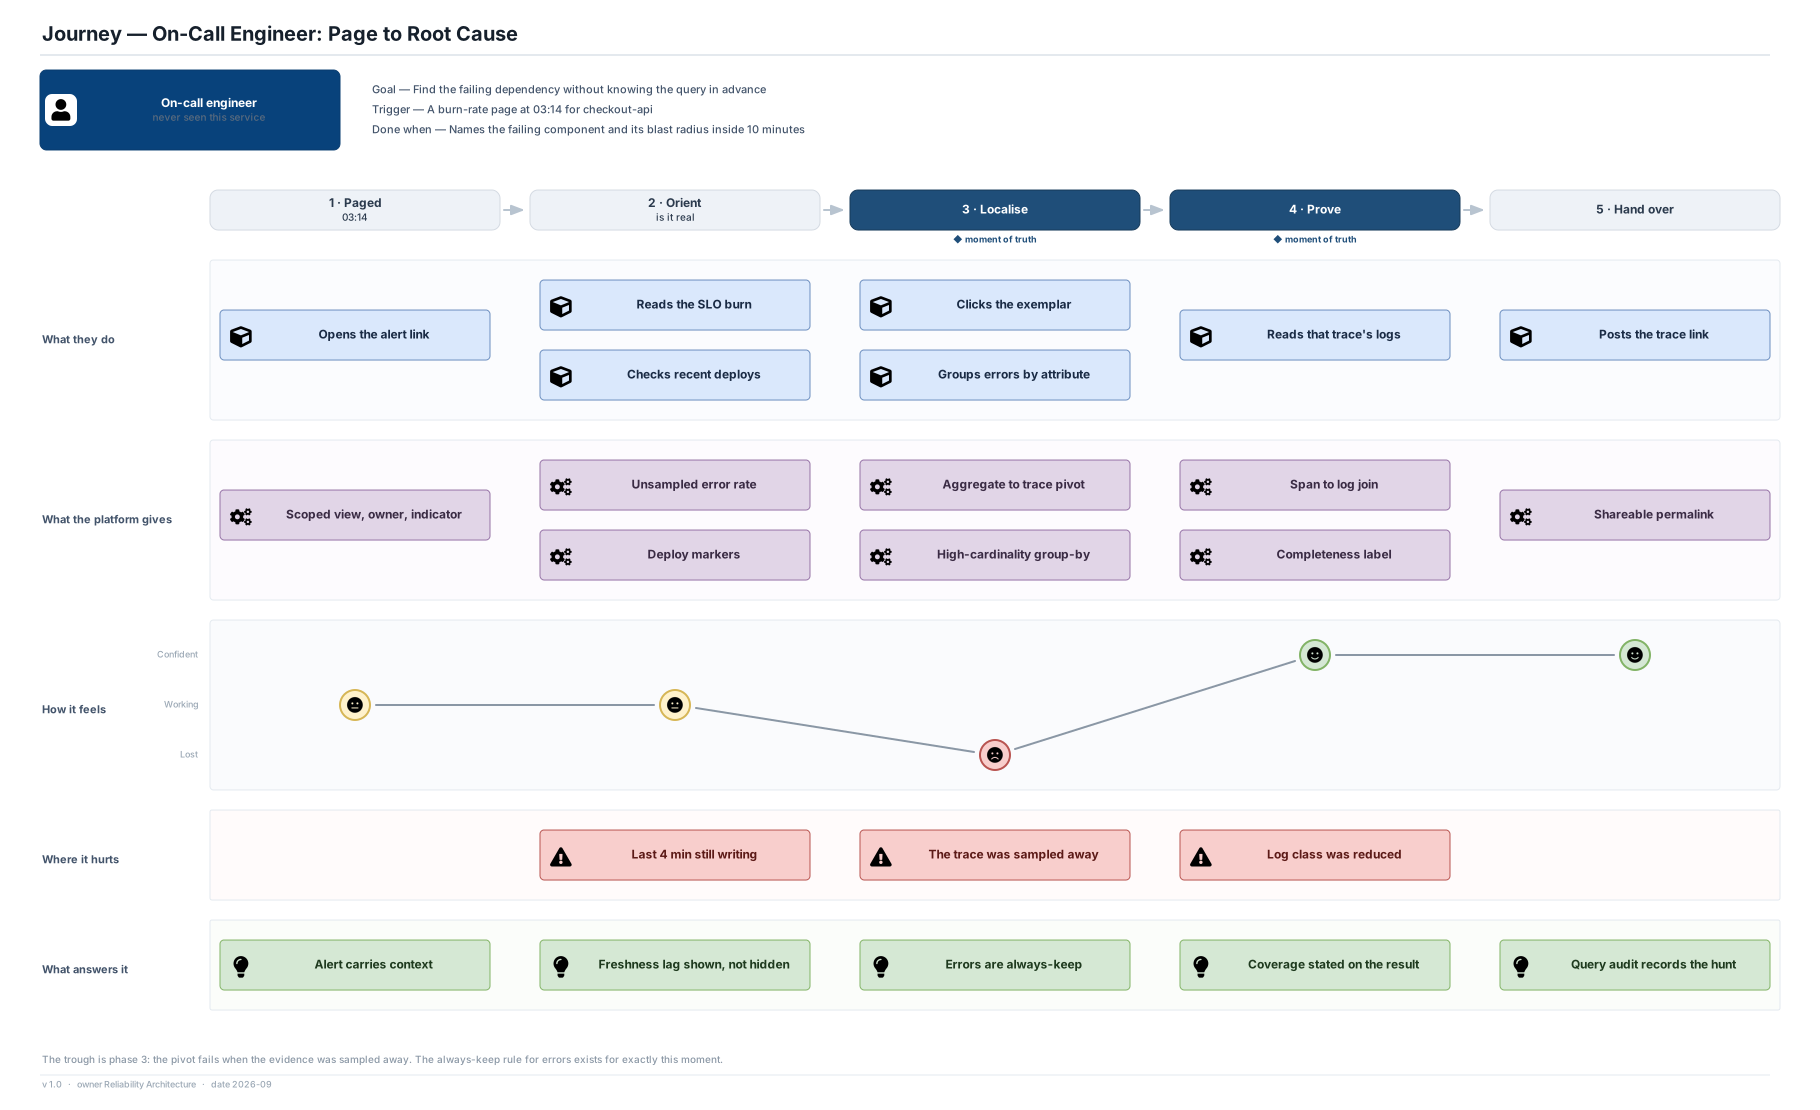
  • RejectedNo join; search the trace store by time and service: Free. It is the manual step that makes the pivot fail in practice, which view 04 identifies as the journey's trough.
  • RejectedStore counts alongside pointers for convenience: Tempting and immediately fatal: a count from the sampled corpus with an authoritative-looking home.
Consequences
What it buys
  • The pivot from chart to trace to log is one action and needs no prior query knowledge
  • The boundary cannot be crossed accidentally in the counting direction
  • The index is small and hot, so the pivot is fast even when the stores are not
What it costs
  • A fourth store to operate, with its own availability in the investigation path
  • Exemplars must survive aggregation, which constrains the metric pipeline
  • When the trace was sampled away the pivot fails, and the honest message is still a disappointment
Choose differently when
If tracing were retained unsampled, the index becomes unnecessary — a direct query on trace attributes serves the same purpose with fewer moving parts.
Why it holds up over time
The exemplar pattern is now in the OpenTelemetry and Prometheus data models rather than in any one product, so the mechanism survives replacing every component underneath it.
LessonWhen you separate two planes for correctness, build the crossing deliberately and make it structurally incapable of carrying what it must not.
Shown on views08 17
ADR-03

An alert rule that reads the sampled corpus is refused at submission

Accepted

How is the completeness boundary kept true a year after launch, when the people who chose it have moved on?

Context
A boundary that exists only in a design document is a boundary for about two quarters. The specific failure is easy to imagine and hard to notice: a team writes an alert on an error count computed from the log or trace store, it works in staging, and in production it under-counts by the sampling rate — so the alert fires late, or not at all, during exactly the incident it was written for. Nothing about the rule looks wrong.
Decision
Alert and SLO rules may only reference the complete path. A rule whose condition reads the trace or log store is rejected when it is submitted, by a CI gate on the rules repository, with a message naming the boundary. This is a build failure, not a runtime warning: a rule that reaches the evaluator has already been proved to read unsampled data.
How it is realised on AWS
Rules live in Git and are rendered by CI. The gate parses each expression, resolves every datasource reference, and fails the build on any that is not the metric store. Rule unit tests run fixture series through the same evaluator the ruler uses.
Options weighed
  • ChosenCI gate at submission: The boundary is enforced by the same mechanism that enforces syntax. Costs a rules repository and a parser that must track the query language.
  • RejectedRuntime warning on the alert: Simpler. A warning attached to an alert nobody reads until it fires is not a control.
  • RejectedReview convention documented for rule authors: No engineering. Survives about as long as the person who wrote the convention.
  • DeferredMake the sampled stores unqueryable by the ruler at all: Strongest form — network and IAM separation rather than a parser. Worth doing in Phase 2 once the rule surface is stable.
Consequences
What it buys
  • The central correctness claim is checked by a machine on every change
  • The failure mode is a red build with an explanation rather than a missed page
  • Rule authors learn the boundary the first time they cross it
What it costs
  • The gate's parser must keep pace with the query language, or it becomes a source of false failures
  • Legitimate log-derived alerting — a genuine need for some teams — has to be met by first promoting the signal to a metric
Choose differently when
If the platform ever offered an unsampled log class with a completeness guarantee, rules over that class would be legitimate and the gate would need to distinguish class rather than store.
Why it holds up over time
Query languages change; the property being checked — does this condition read data that is complete — does not, and it is expressible against any of them.
LessonAn architectural boundary is only real once something automated fails when it is crossed.
Shown on views08 20 15

Collection and admissionHow telemetry leaves a process, who says what it is, and where the platform is allowed to say no.

ADR-04

A node agent collects; the application never holds a durable buffer and never retries to a remote endpoint

Accepted

Where does telemetry go when it leaves a process, and who is responsible for it not being lost?

Context
The tempting design has each application export directly to a regional endpoint with retry and a local queue. It removes a component, and it makes every application's performance dependent on the observability platform's availability and latency. Worse, it makes the telemetry path a source of application memory growth during a platform incident — the failure mode where the monitoring system takes down the thing it monitors. The estate has 900 services in several languages, so anything asked of the application has to be implemented correctly nine hundred times.
Decision
Applications export over localhost to a node agent and do not retry, buffer durably, or block. The agent owns batching, compression, a bounded local spool, shedding by class and retry to the gateway. The agent bounds its own resource use and sheds its own telemetry before degrading the workload sharing the host. An agent or node loss is a telemetry gap for that host, reported as a gap, and never recovered by asking the application to have kept a copy.
How it is realised on AWS
ADOT Collector as an EKS DaemonSet and as a systemd unit on EC2, receiving OTLP on localhost, scraping host and container metrics without application cooperation, and exporting OTLP/gRPC to the gateway NLB. Resource limits are set on the DaemonSet; the spool is a bounded file-backed queue with class-ordered eviction.
Options weighed
  • ChosenNode agent with a bounded spool: One implementation of the hard part per platform, not per language. Costs an agent on every host and its rollout risk.
  • RejectedDirect from SDK to regional gateway: Fewer components. Puts platform latency and availability inside 900 application processes.
  • RejectedSidecar per pod: Better tenant isolation than a DaemonSet. At 40,000 containers the overhead is 40,000 collectors and a much larger config surface.
  • RejectedApplication-side durable queue: Loses nothing on a platform outage. Turns every application into a queue operator and every platform incident into an application memory incident.
Consequences
What it buys
  • A platform outage is never an application outage
  • Batching, compression and shedding are implemented and tuned once
  • Infrastructure telemetry is collected from uninstrumented services without their cooperation
What it costs
  • An agent fleet of 12,000 to release, version and secure (ADR-23)
  • A node loss loses its in-flight telemetry, and the design accepts that rather than hiding it
  • A DaemonSet is shared by every pod on the node, so one noisy pod can affect its neighbours' telemetry
Choose differently when
In a small estate with one or two languages and a very high value on losing nothing, direct export with an application-side queue is defensible and simpler.
Why it holds up over time
The agent boundary has outlived several generations of collection software because it is a statement about responsibility, not about a protocol: the application produces, the platform transports.
LessonNever ask the thing you are observing to be responsible for the observation surviving.
Shown on views09 12
ADR-05

Resource identity comes from the credential the workload proved, never from the payload

Accepted

When telemetry arrives claiming to be from checkout-api, what makes that true?

Context
Every downstream property of the platform depends on the answer: ownership, cardinality budgets, cost attribution, retention class, authorisation to read, and who gets paged. If the service name is whatever the payload says, then a misconfigured job can spend another team's budget, a hostile client can pollute a production service's metrics, and the cost ledger is fiction. The convenient default in every collector is to take the resource attributes as given.
Decision
The collection tier overwrites resource identity from the workload's scheduling metadata and from the identity it proved to the gateway. Self-declared service identity in the payload is recorded as a hint and never used for attribution. A credential that identifies a team, an environment or a person rather than a single workload is rejected at ingest. Client telemetry from the untrusted zone can never resolve to an in-house service identity at all.
How it is realised on AWS
EKS Pod Identity and IAM Roles Anywhere issue per-workload roles; the agent signs with SigV4 and the gateway resolves the caller's role ARN to a catalogue entry. Kubernetes downward API supplies namespace, workload and version. The untrusted receiver runs behind API Gateway on a separate listener whose resolved identity is always a client tenant.
Options weighed
  • ChosenIdentity from the proved credential: Attribution is as trustworthy as the estate's workload identity. Requires every producer to have one.
  • RejectedTrust resource attributes in the payload: Works on day one with no identity plumbing. Makes every budget, bill and access decision unenforceable.
  • RejectedShared per-team ingest API keys: Simple to issue. A leaked key is an estate-wide write credential, and attribution stops at the team.
  • right elsewheremTLS with a workload certificate: Equivalent guarantee and the better answer off AWS or in a mixed estate; here it duplicates an identity system that already exists.
Consequences
What it buys
  • Cost, budget and ownership attribution are enforceable rather than cooperative
  • A compromised or misconfigured producer cannot impersonate another service
  • Access control on the read path has something real to bind to
What it costs
  • Every producer needs a workload identity before it can emit — a genuine onboarding dependency
  • Ingest depends on STS availability for workloads starting during an incident
  • Legacy and third-party producers need a mapped identity or a quarantined tenant
Choose differently when
If the platform were single-tenant with no chargeback and no per-team access control, payload-declared identity would be adequate and much cheaper to run.
Why it holds up over time
Workload identity is moving towards being ambient in every runtime. The rule — attribution follows proof, not assertion — gets easier to honour over time, never harder.
LessonAnything you plan to bill, budget or authorise on must be derived from something the sender proved, not something it said.
Shown on views24 09
ADR-06

Cardinality is admitted at the gateway, and a label is dropped before a series is rejected

Accepted

Where does the platform stop an unbounded label, and what does it do when it finds one?

Context
Cardinality is the dominant cost and failure driver of any metric system, and the classic incident is a deploy that adds a user identifier or a URL with an embedded key to a metric label. The store discovers it as memory pressure, minutes to hours later, by which time the damage is estate-wide. Enforcing in the SDK stops it at the source but puts the limit in a library that cannot be changed without redeploying 900 services. Enforcing at the store is the last line and fails as an outage rather than as a rejection.
Decision
Cardinality budgets are enforced at the gateway as an admission decision, per service and per metric, before anything is buffered or written. When a budget is exceeded the platform first drops the offending label — collapsing the series into a lower-cardinality parent so the measurement survives — and only rejects the series when dropping is not possible. Every action produces an attributed enforcement event naming the specific attribute. A pre-production estimate runs in CI so the common case is caught at review.
How it is realised on AWS
A custom OTel Collector processor evaluates per-service budgets loaded from the control plane, with a label-value ceiling and an unbounded-value detector for identifier-shaped and URL-shaped values. Enforcement events go to ClickHouse and to the owning team's scorecard the same day. Mimir's own per-tenant limits remain configured as a backstop, deliberately above the gateway budget.
Options weighed
  • ChosenGateway admission, degrade then reject: Updatable in seconds, preserves the aggregate, and names the attribute. Costs a stateful-ish processor in the hot path.
  • RejectedSDK-side limits: Zero downstream cost. A cardinality incident would then take an estate-wide redeploy to stop.
  • RejectedStore-side limits only: No new component. The first symptom is an ingester falling over, which is a platform outage caused by one team's deploy.
  • right elsewhereReport and bill, never block: Reasonable where the metric store is elastic and the budget is a money problem rather than an availability one.
Consequences
What it buys
  • One team's bad deploy cannot degrade the platform for everyone else
  • The aggregate survives the incident, so dashboards and alerts keep working at reduced detail
  • The owning team learns the same day, with the attribute named
What it costs
  • The gateway carries budget state and becomes more than a stateless forwarder
  • Label-dropping is a silent change of meaning to anyone who does not read the enforcement record
  • A legitimately high-cardinality service needs an exception, and exceptions need expiry and review
Choose differently when
If the metric store could absorb unbounded cardinality at predictable cost, this becomes purely a billing question and the enforcement point moves to the ledger.
Why it holds up over time
Every metric system built so far has been cardinality-bound, and the ones that are not shift the same constraint into cost. Admission at the edge stays the right place for it whichever way that goes.
LessonEnforce a limit where you can still explain it to the person who caused it, and prefer losing a dimension to losing a measurement.
Shown on views09 22
ADR-07

Redaction happens before the first write, and every redaction is counted

Accepted

Logs will contain personal data despite policy. Where is that dealt with?

Context
Every organisation has a policy that personal data does not go in logs, and every log store contains some. Detecting it after the fact means it has already been written, replicated, tiered and possibly read — and the remediation is a deletion across every tier rather than a non-event. Detecting it at read time protects the reader and not the store. The only place where a redaction is genuinely preventive is before the record is durable.
Decision
Pattern-based detection and redaction run at the gateway, before anything reaches the buffer. Every redaction is counted and attributed to the emitting service so that redaction volume is a signal about instrumentation quality rather than an invisible safety net. Redaction is explicitly not treated as making the log store safe to open widely: authorisation by data class (ADR-14) is the second control, and the two are argued separately.
How it is realised on AWS
A collector processor applies a maintained pattern set — card numbers, national identifiers, email addresses, bearer tokens, and per-tenant custom patterns — replacing values with a typed placeholder and emitting a counter keyed by service and pattern. Patterns are versioned in the config repository and released through the pipeline in view 20.
Options weighed
  • ChosenRedact at the gateway, before the buffer: Nothing unredacted is ever durable. Costs CPU in the hot path and accepts that patterns miss things.
  • RejectedRedact in the SDK: Even earlier and cheaper per record. Pattern updates would need an estate-wide redeploy.
  • RejectedRedact on read: Protects the console. Leaves the raw data in the store, in backups, and in the cold tier forever.
  • RejectedDetect and alert, do not modify: Preserves fidelity for debugging. Converts every detection into a deletion project across five tiers.
Consequences
What it buys
  • The log store's worst-case contents are bounded by what the patterns miss, not by what teams remember
  • Redaction volume per service becomes a measurable instrumentation-quality signal
  • Subject erasure has a smaller surface to reach
What it costs
  • Pattern matching on 1.2 million lines per second is a real CPU cost in the ingest path
  • A redacted field is sometimes the field an engineer needed, and there is no recovery
  • False confidence is the standing risk: redaction reduces exposure and does not eliminate it
Choose differently when
If the estate could genuinely guarantee structured logging with a typed schema and no free-text bodies, field-level classification would replace pattern matching and be both cheaper and more reliable.
Why it holds up over time
Whatever the regulation and whatever the detection technique, the placement argument holds: the only redaction that prevents rather than remediates is the one that happens before the record is durable.
LessonPut a data-protection control where its failure is a miss rather than a cleanup project.
Shown on views23 09

Reduction and samplingWhat is discarded, under what rule, and how the reader finds out.

ADR-08

Tail sampling with a 45-second hold, whole traces only, sharded by trace identifier

Accepted

Which traces are kept, and is that decided before or after the platform knows whether the request was interesting?

Context
Head sampling decides at the first span, cheaply and statelessly, before it knows whether the request errored or was slow — which is exactly what makes a trace worth keeping. Tail sampling decides once the trace is complete, which requires holding every span of every in-flight trace for a window and routing all spans of a trace to the same decision point. At 2.5 million offered spans per second the hold window is a memory budget sized against the worst burst, and the sampler becomes the only memory-bound tier in the ingest path.
Decision
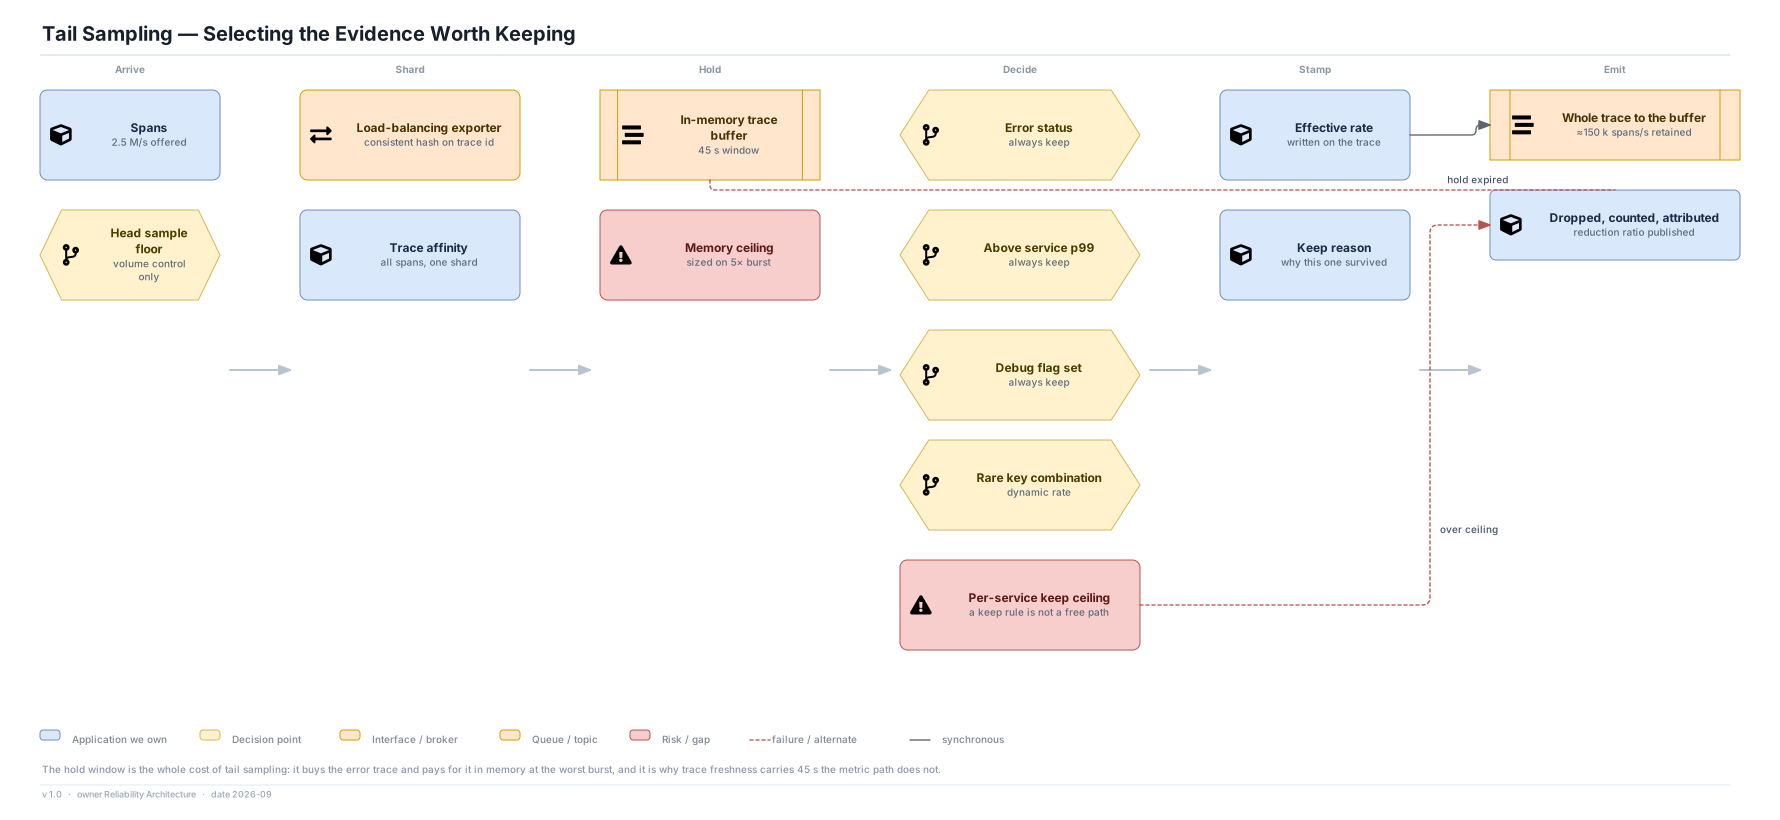
A head-sampled floor provides coarse volume control; tail sampling does the evidence selection. Spans are routed by consistent hash on trace identifier so every span of a trace reaches one shard. The hold window is 45 seconds, assumed to cover p99.9 of in-house request duration. A trace selected by the sampler is kept whole. Keep rules — error status, above the service's p99, debug flag, declared critical routes — are unconditional but carry a per-service keep ceiling, because an unconditional rule is otherwise an unbounded ingest path that fires hardest during an incident.
How it is realised on AWS
Collector gateways export via the load-balancing exporter to a dedicated memory-optimised node group running the tail-sampling processor with policy sets per service. Hold-window occupancy, eviction rate and decision latency are first-class platform metrics; the node group is sized at 5× steady-state burst headroom.
Options weighed
  • ChosenHead floor plus tail selection: Keeps the traces that matter and bounds the volume. Costs a stateful tier and 45 s of trace freshness.
  • RejectedHead sampling only: Stateless, cheap and trivially scalable. Discards error traces at the same rate as successful ones, which fails view 04's trough.
  • RejectedTail sampling only, no head floor: Best selection quality. The sampler must then hold the full offered rate, which multiplies the memory budget.
  • DeferredKeep everything for a short window, then select: Storage-based selection removes the memory ceiling and adds a write amplification. Worth revisiting if object-store write costs keep falling.
Consequences
What it buys
  • The error trace an engineer needs is present at the moment they look for it
  • Retained span volume is roughly 6% of offered, at a known and tunable cost
  • Whole-trace retention means a pivot never lands on half an answer
What it costs
  • Trace freshness carries 45 s the metric path does not (p95 ≤ 75 s to queryable)
  • The sampler must be sized for the worst burst rather than the average
  • Shard loss during the hold window loses in-flight decisions, which view 12 names as an accepted volatile store
Choose differently when
If request durations were long-tailed beyond the window — batch or streaming workloads rather than request/response — the hold window becomes untenable and storage-based selection is the right answer.
Why it holds up over time
The head-versus-tail trade is a property of distributed tracing itself, not of any implementation. The constants move; the shape of the decision does not.
LessonIf you want to keep the interesting cases, you have to wait long enough to know which ones they are, and that wait has a price you must state.
Shown on views16 09
ADR-09

Log reduction is by declared class, not by a global rate

Accepted

When log volume must come down, which lines go?

Context
A global sampling rate on logs is simple and treats a payment failure and a health-check access line as equally disposable. It also makes the surviving corpus statistically odd in ways nobody tracks. The alternative is to let teams declare what each of their log streams is for, which is correct and depends on a step teams routinely skip — which is itself the risk that has to be designed for rather than assumed away.
Decision
Every service declares its log classes, with platform defaults. Structured error and compliance-relevant classes are retained in full. High-volume debug and access classes are sampled or aggregated. Reduction is applied per class, the reduction ratio per service and class is published, and the shed order under a storm (ADR-10) follows the same classes. A service that declares nothing gets the defaults and is reported as undeclared on its scorecard.
How it is realised on AWS
Class is a resource attribute set by the SDK or by the agent from a per-service config in the catalogue. A collector processor applies the class policy — pass, sample at rate, aggregate to a count — and emits per-class reduction counters. Class-level retention is expressed as ClickHouse partitions plus S3 lifecycle rules.
Options weighed
  • ChosenPer-class declared reduction: The right lines survive when it matters. Depends on declarations teams must actually make.
  • RejectedOne global sampling rate: Needs no cooperation. Discards evidence and noise at the same rate, and biases the corpus invisibly.
  • right elsewhereVolume quota per service, team chooses how to meet it: Strong incentive alignment and much less platform machinery. Needs teams with the capacity to tune, which 70 teams unevenly have.
  • RejectedKeep everything, tier aggressively: No reduction decisions at all. At 6 TB/day the tiering saves storage and not ingest, which is where much of the cost is.
Consequences
What it buys
  • An incident's error logs are never sampled away to make room for health checks
  • The reduction ratio is visible per service, so nobody has to guess what is missing
  • The storm response has a defensible order rather than a random one
What it costs
  • Classification is real work at onboarding and is the step most likely to be skipped
  • If most services accept defaults, the shed order degenerates towards shedding at random
  • Class is another attribute that must be correct, and a mis-classified stream is worse than an unclassified one
Choose differently when
If log volume were small enough to retain in full, class would remain useful for retention and access control but would stop being a reduction mechanism.
Why it holds up over time
The declaration outlives the pipeline: whatever performs the reduction in five years still needs to be told which lines are evidence, and only the emitting team knows.
LessonReduction policy belongs to whoever knows what the data is for; the platform's job is to make the declaration cheap and its absence visible.
Shown on views18 05
ADR-10

The shed order is declared in advance, and the metric path is not in it

Accepted

When ingest exceeds what the platform can absorb, what is dropped?

Context
The platform's load is positively correlated with the failures it exists to explain: an incident produces an error-log storm, retry amplification and a dashboard stampede at the same moment. Something has to give, and deciding what under pressure means deciding badly. Absorbing everything means sizing ingest and storage for the worst incident rather than the steady state, which is headroom that is idle almost always.
Decision
The platform absorbs 5× steady state for 10 minutes without loss. Beyond that it sheds in a fixed, published order: debug log classes, then access log classes, then trace sampling rate. The metric path is not in the order at all, because shedding it would falsify every count during exactly the incident the counts are for. Every shed volume is counted, attributed to a team, and surfaced in the same interface where the data is missing.
How it is realised on AWS
Gateway processors implement priority admission keyed on signal and class, driven by buffer produce latency and spool depth. Shed counters are per team, per class and per minute, and a shed event writes a gap marker that query results carry through as reduced coverage.
Options weighed
  • ChosenFixed published order, metrics exempt: Predictable under pressure and defensible afterwards. Depends on class declarations being real (ADR-09).
  • right elsewhereAbsorb everything; size for the worst incident: Never loses evidence. Correct where the worst incident is affordable to size for; here it is a large permanent idle cost.
  • RejectedShed proportionally across all signals: Fair-looking. Makes counts wrong precisely when they matter most.
  • RejectedUnbounded queueing instead of shedding: Loses nothing in principle. Converts a 10-minute incident into hours of freshness lag and a catch-up flood.
Consequences
What it buys
  • Counts, rates and alerting stay true through the storm
  • The loss is bounded, named and attributed rather than arbitrary
  • Recovery is a replay from the retained buffer offset, not a permanent hole
What it costs
  • The evidence corpus is thinnest exactly when it is most wanted
  • Headroom for 5× is real money spent on capacity that is idle almost always
  • The order is only as good as the class declarations behind it
Choose differently when
If the buffer could be made deep and cheap enough to absorb any plausible storm — and the resulting freshness lag were acceptable — shedding could be replaced by queueing with a published lag.
Why it holds up over time
The correlation between incident and telemetry volume is structural. Any future platform will face the same choice, and having the order written down before the incident is the transferable part.
LessonDecide what you will drop while nothing is on fire, publish it, and exempt the data your decisions are made from.
Shown on views18 12

Storage and retentionThe replay point, the substrate, the tiers, and the one class that outlives the rest.

ADR-11

One durable buffer between admission and every writer is the platform's single replay point

Accepted

What makes a storage failure a recoverable event rather than a permanent hole?

Context
Three stores with different technologies, different failure modes and different maintenance windows are each capable of being unavailable for an hour. If each writer consumes directly from the gateway, an hour of downtime is an hour of lost telemetry, and every store needs its own durability story. A shared buffer converts all of those into lag rather than loss, at the price of one more distributed system in the critical path and a retention window that is real money.
Decision
A single durable, partitioned stream sits between the gateway and every storage writer. It is the only component whose loss beyond its replication is a data-loss event, and everything downstream is replayable from it within its retention. Retention is 72 hours, which is the platform's actual RPO story: a writer can be down for most of a long weekend and lose nothing.
How it is realised on AWS
Amazon MSK across three availability zones, topics per signal, partitioned on service identifier so one service's traffic does not concentrate on one partition, with consumer groups per store. Consumer lag is a first-class alerting signal (view 21), and produce latency drives the shed decision in ADR-10.
Options weighed
  • ChosenOne durable buffer, 72 h retention: Turns storage outages into lag. Costs a managed Kafka cluster and its retention storage.
  • RejectedDirect gateway-to-store writes: Lowest latency and fewest components. Every store outage becomes permanent loss and every store needs its own buffering.
  • RejectedA buffer per signal: Independent tuning and blast radius. Three clusters to run for a marginal isolation gain over topic separation.
  • right elsewhereObject storage as the buffer: Much cheaper at depth and entirely reasonable for logs alone; the per-object latency does not suit the metric path's freshness target.
Consequences
What it buys
  • Storage maintenance, migration and failure are lag events rather than loss events
  • Only one component in the platform carries a real RPO
  • A new store or a reprocessing job can be built by replaying history rather than by waiting for new data
What it costs
  • A cluster in the critical path of every signal, whose unavailability sheds telemetry
  • 72 hours of retention at this volume is a significant standing cost
  • Shortening retention to save money quietly shortens every store's recoverability
Choose differently when
If every store had strong native durability and generous internal buffering, the shared buffer would be redundant machinery in the hot path.
Why it holds up over time
The log-as-replay-point pattern has survived every generation of streaming technology because the property it provides — recoverability decoupled from consumer availability — is what makes multi-store pipelines operable at all.
LessonPut durability in one place, make everything downstream rebuildable from it, and be explicit that its retention window is the real recovery objective.
Shown on views02 12
ADR-12

Object storage is the retention substrate; query capacity scales without moving data

Accepted

What does the platform's data actually live on, and what happens when query demand doubles?

Context
Cluster-local storage ties retention to cluster size: keeping data longer means running more nodes, and answering more queries means moving data onto them. At the volumes here that coupling makes every capacity decision a data-migration project, and it makes a query surge during an incident unanswerable by adding capacity — which is precisely when it is needed. The counter-argument is real: querying object storage is slower and needs a caching tier to be interactive at all.
Decision
All long-lived telemetry lives in object storage, with stateless or cache-backed query engines reading from it. Retention becomes a storage-class and lifecycle decision rather than a cluster-sizing one, and storage, query and ingest scale independently of each other.
How it is realised on AWS
Mimir blocks, Tempo blocks and ClickHouse parts all on S3, with lifecycle transitions to Glacier Instant Retrieval for the cold log tier. Query engines run on EKS node groups and EC2 with local NVMe used as cache rather than as the record. Athena serves rehydrated cold queries.
Options weighed
  • ChosenObject storage substrate for all three signals: One retention mechanism and independent scaling. Costs a caching tier and a higher latency floor.
  • RejectedCluster-local storage with replication: Lowest and most predictable query latency. Retention and query capacity become one coupled, expensive decision.
  • chosen in partHybrid: hot local, warm and cold on object storage: This is what the hot tier is — local NVMe as a cache. The distinction held here is that the cache is never the record.
  • right elsewhereA managed per-signal service for each store: Far less to operate and the correct answer for a smaller team; it gives up the per-tenant limits and cost control this estate needs.
Consequences
What it buys
  • Retention is changed with a lifecycle rule rather than a migration
  • A query surge is answered by adding query capacity, with no data movement
  • Losing a query node loses cache, never data
What it costs
  • Interactive latency depends on a cache that must be warm, which is worst right after a deploy or a failover
  • Object request costs are a real line item at this query volume and must be watched
  • Three engines each with their own block format on one substrate is three tuning problems, not one
Choose differently when
For a small, latency-critical estate with modest retention, local storage is simpler, faster and cheaper, and the coupling never becomes painful.
Why it holds up over time
Separation of storage from compute has been the direction of travel for every analytical system for a decade, and object storage economics keep improving relative to attached disk.
LessonIf retention and query capacity are the same knob, you will eventually choose between remembering and answering.
Shown on views12 14
ADR-13

Cold data is kept raw and rehydrated, rather than downsampled and discarded

Accepted

What happens to telemetry older than the warm tier: is it summarised, or kept and made slow?

Context
Downsample-and-discard is cheap, bounded and permanently forecloses any question about a specific request from six months ago. Keep-and-rehydrate preserves those questions at a storage cost that grows forever and a retrieval latency that makes the data useless in an incident. The honest question is how often anyone genuinely needs raw data older than thirty days, and the honest answer is: rarely, and unpredictably, and usually because of an audit or a regression that was introduced long before it was noticed.
Decision
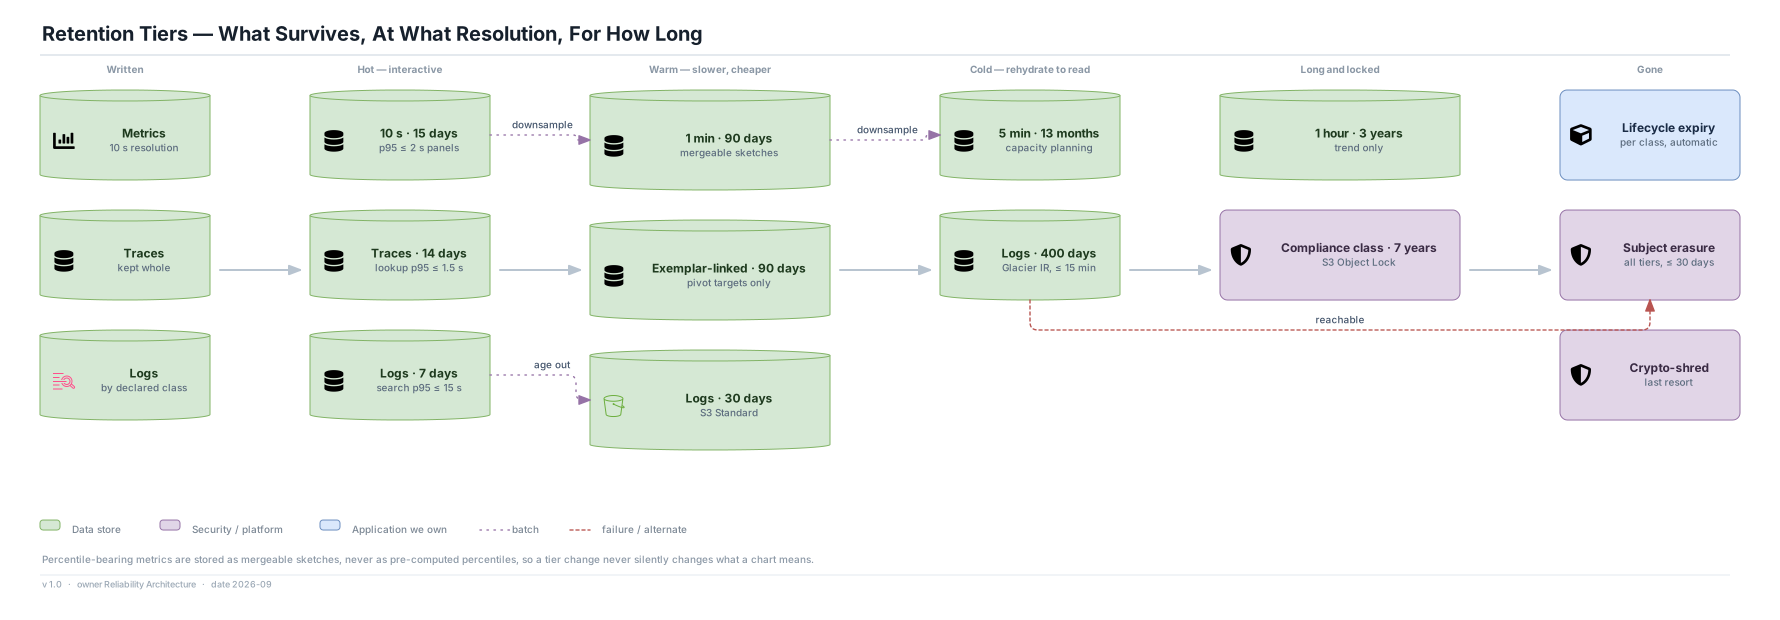
Metrics are downsampled through declared resolutions — 10 s, 1 min, 5 min, 1 hour — and are never discarded within their retention, with percentile-bearing metrics stored as mergeable sketches so re-aggregation stays correct. Logs are kept raw to 400 days in a cold class and rehydrated on request within 15 minutes. The cold tier is explicitly not an incident tool, and the platform says so rather than letting anyone discover it at 03:14.
How it is realised on AWS
Mimir compactor produces the downsampled resolutions; the response states the resolution served. S3 lifecycle moves log partitions to Glacier Instant Retrieval at 30 days; a rehydration request restores the partitions and exposes them to Athena, with the request queued and its completion notified.
Options weighed
  • ChosenRaw cold with rehydration: Unanticipated questions stay answerable. Costs storage that grows and a latency that excludes incident use.
  • RejectedDownsample and discard: Bounded and cheap. Forecloses per-request questions permanently, including the compliance ones.
  • right elsewhereSummarise into a warehouse and discard the raw: Good where the long-range questions are known in advance and aggregate in nature.
  • RejectedKeep raw in the warm tier for 400 days: Removes the rehydration wait. Roughly an order of magnitude more expensive for data read a handful of times a year.
Consequences
What it buys
  • An audit or a long-latent regression is answerable from primary records
  • Metric history stays honest across tier boundaries because sketches re-aggregate correctly
  • The compliance class already required raw retention, so the marginal decision is smaller than it looks
What it costs
  • Cold storage grows monotonically and needs an explicit review cadence
  • Fifteen minutes is useless during an incident, and people will discover that at the worst moment
  • Rehydration has its own cost that is easy to trigger accidentally
Choose differently when
If two years of usage showed cold rehydration being used a handful of times, downsample-and-discard becomes the right answer and the saving is substantial. This is the ADR most likely to be revisited with data.
Why it holds up over time
Archive storage keeps getting cheaper faster than the questions get easier to anticipate, which tends to strengthen the case for keeping raw over time.
LessonYou cannot know today which question you will need to answer in a year — but you can know how long you are willing to wait for the answer.
Shown on views14
ADR-14

The compliance class is separable, with its own retention, its own audience and keys held outside the platform

Accepted

Some telemetry must be kept for seven years and read by very few people. Does that obligation apply to everything?

Context
If one retention obligation is applied to the whole corpus, the platform keeps 6 TB a day for seven years to satisfy a requirement that covers perhaps 1% of it. If it is applied by ad-hoc query at deletion time, the obligation is enforced by a script nobody reviews. And subject erasure — deleting a named person's records across every tier including cold — is either designed for or effectively impossible.
Decision
A security- and compliance-relevant log class is declared at emission, stored separately, retained for seven years under storage-level locked retention, and readable by a narrower audience than general telemetry. Everything else expires on its own schedule. Encryption keys are held outside the platform so that crypto-shredding a class is available as a deletion mechanism of last resort, and targeted subject erasure across all tiers completes within 30 days.
How it is realised on AWS
The class routes to its own S3 prefix under Object Lock in compliance mode, with a KMS key the platform's own roles cannot schedule for deletion. Read access is a separate IAM role granted to a small group through IAM Identity Center; every read is written to the query audit first (ADR-16). Erasure is a per-subject key derivation plus tombstone, run as a scheduled job across warm and cold prefixes.
Options weighed
  • ChosenSeparable class, locked retention, narrow audience: The obligation is bounded to the data it applies to. Costs another class to declare and another access path to run.
  • RejectedOne retention policy for all telemetry: Simplest possible. Either everything is kept seven years, or the obligation is not met.
  • right elsewhereExport compliance events to a separate system entirely: Cleanest separation and the correct answer where the audit obligation is heavy; here it duplicates collection for a small subset.
  • RejectedRetention enforced by application logic: Flexible. A writer that can delete is a writer that can be made to delete, which is not an audit control.
Consequences
What it buys
  • The expensive obligation covers about 1% of the corpus instead of all of it
  • Immutability is enforced by the storage layer, not by the code that writes to it
  • Erasure has a designed path rather than an escalation
What it costs
  • Class declaration is load-bearing for a legal obligation, and a mis-declared stream is a compliance gap
  • A narrower audience means real friction for engineers who occasionally need it
  • Locked retention means an over-broad class cannot be cheaply undone
Choose differently when
If the whole estate fell under a uniform retention obligation, separation buys nothing and a single locked class is simpler.
Why it holds up over time
Regulations change their durations and their subjects, not their shape: something must be immutable, something must be erasable, and the two must be separable. A design that can express all three survives the rewrites.
LessonScope an expensive obligation to the data it actually covers, and enforce it below the layer that would otherwise be asked to break it.
Shown on views12 23

Query and correlationHow three very different stores answer one investigation, and what every answer must admit about itself.

ADR-15

Three signal-specific stores behind one query surface, rather than one engine over one store

Accepted

Should the three signals share a physical store and a query language, or be federated behind a common surface?

Context
The three signals have genuinely different access patterns: dense recent time series read by range, sparse text and attribute search over large partitions, and trace assembly by identifier. One columnar substrate can serve all three and will suit none of them well, particularly the metric path, where the query rate and latency budget are most demanding. Federation lets each store be right for its signal and pushes the correlation problem into an index and a query planner that must stitch results with different latencies and different completeness.
Decision
Each signal keeps a store suited to its access pattern. One query surface sits in front of them, providing a common entry point, per-tenant admission, result caching and the completeness labelling in ADR-16. Cross-signal correlation is served by the exemplar index and by trace identifier joins rather than by a distributed join across stores.
How it is realised on AWS
Mimir for metrics, Tempo for traces, ClickHouse for logs and high-cardinality group-by, DynamoDB for exemplars, all reachable through a query frontend that fronts Amazon Managed Grafana. Each store has its own per-tenant limits; the frontend owns admission, caching and the coverage statement on every result.
Options weighed
  • ChosenFederated per-signal stores, one surface: Each access pattern gets a store built for it. Costs three systems to operate and a correlation layer.
  • right elsewhereOne columnar store for all three signals: Correlation becomes a join and there is one dialect to learn. Strong choice at lower metric query rates; here the metric path's latency budget is the objection.
  • right elsewhereOne vendor's integrated suite: Much less to operate and correlation solved in the product. Gives up the per-tenant cost control that view 06 depends on.
  • RejectedFederated stores, no common surface: Least platform code. Puts three query languages and three coverage stories in front of an on-call engineer at 03:14.
Consequences
What it buys
  • Each store is tuned for one access pattern rather than compromised for three
  • A failure or upgrade in one store degrades one signal rather than all of them
  • Per-tenant limits can differ per signal, which matches how the cost actually differs
What it costs
  • Three storage systems to operate, upgrade, capacity-plan and be on call for
  • Correlation is a designed feature rather than a free consequence of colocation
  • A federated result must state coverage honestly when one member returns partial, which is the hardest part of ADR-16
Choose differently when
If one engine could meet the metric path's query rate and latency budget while retaining raw attributes, the single-store design wins on simplicity and on correlation quality together.
Why it holds up over time
The access patterns are properties of the signals and will not converge. What may change is whether one engine can serve all three well — which is the condition to re-test, not the decision to defend.
LessonFederate when the access patterns genuinely differ, and then spend the saving on making the crossing between them excellent.
Shown on views10 17
ADR-16

Every result states its completeness, and a partial answer beats a timeout

Accepted

What does the platform return when it cannot fully answer, and how does the reader know what they are looking at?

Context
Three things routinely make a result less than complete: the data was sampled, a tier or shard did not answer, or the query exceeded its budget. In every case the default behaviour of most systems is to return what they have and say nothing, or to fail with an error. Both are worse than they look. An engineer who computes an error count from a 6% corpus and is not told is wrong by a factor of sixteen; an engineer whose group-by times out learns to stop asking.
Decision
Every result carries its completeness: the sampling rate applied, the tiers consulted, any shard that did not answer, and the resolution of the data returned. A query that exceeds its budget returns a partial result with a stated coverage rather than timing out. Reading production telemetry is an audited action, written before the query executes.
How it is realised on AWS
The query frontend annotates every response with a coverage envelope built from per-store partial-result reporting and the effective sampling rate on the records read; Grafana panels render it as a coverage badge. The audit entry is written to Aurora and copied to the audit store before execution, so an interrupted query is still recorded as an attempt.
Options weighed
  • ChosenCoverage on every result, partial over timeout: The reader always knows what they have. Costs a coverage model each store must support honestly.
  • RejectedFail the query when it cannot be answered completely: Never misleading. During an incident it converts a degraded answer into no answer, which is the worse outcome.
  • RejectedReturn what is available, say nothing: What most systems do. It is the single most effective way to destroy trust in an observability platform.
  • RejectedCoverage only on the sampled stores: Cheaper. A shard that did not answer makes a complete-path result incomplete too, and that is the case nobody expects.
Consequences
What it buys
  • An engineer can tell the difference between "there were no errors" and "we did not keep the evidence"
  • Exploratory queries stay usable under load instead of timing out
  • Access to production telemetry is accountable
What it costs
  • Every store must report partial results honestly, which not all of them do natively
  • Coverage badges are one more thing on a dashboard that people can learn to ignore
  • Auditing before execution adds a write to the read path
Choose differently when
If everything were retained unsampled and queries always completed, coverage would collapse to a shard-availability flag and could be an exception rather than a field.
Why it holds up over time
A result that cannot describe its own limits is a hazard in any data system, and the pressure to state provenance and completeness is increasing everywhere, not decreasing.
LessonThe most dangerous answer is a plausible one with an unstated caveat. Make the caveat part of the answer.
Shown on views17 21

Alerting and evaluationThe plane that pages a human, what it is allowed to read, and the failure that looks like health.

ADR-17

Alert evaluation runs on its own capacity and reads the store directly

Accepted

What must keep working when the dashboards do not?

Context
The console and the alert evaluator both read the metric store, and the easy design has both go through the query frontend so that caching, admission and authorisation are implemented once. It also means that a dashboard stampede during an incident, or a bad deploy of the frontend, can stop alerts from firing — a failure that is invisible until a page that should have arrived did not. Alerting is the one function whose absence cannot be noticed by its users.
Decision
The alert evaluation plane runs on its own node groups, with its own scaling and its own deployment cadence, and reads the metric store directly rather than through the query frontend. Interactive query carries 99.9% monthly and alert evaluation carries 99.99%. On a control-plane outage the evaluator continues on last-known rules and never fails an evaluation into silence; every missed evaluation is recorded.
How it is realised on AWS
Mimir ruler on a dedicated EKS node group with no shared capacity with the queriers, its rules loaded from the control plane and cached locally. Missed evaluations, rule-group evaluation duration and the ruler's own liveness are reported to the self-telemetry account in view 19.
Options weighed
  • ChosenSeparate plane, direct store reads: A query-tier failure cannot stop a page. Costs dedicated capacity that is idle most of the time.
  • RejectedEvaluate through the shared query frontend: One caching and authorisation implementation. Couples paging to the availability of a tier humans are hammering.
  • right elsewhereEvaluate at the edge, close to ingest: Lowest possible detection latency. Cannot express rules that need a query over history, which most SLO burn rules do.
  • RejectedPush evaluation to the paging platform: Moves the dependency rather than removing it, and puts telemetry query logic in a system that is not built for it.
Consequences
What it buys
  • Paging survives a query-tier outage, a dashboard stampede and a console deploy
  • Alerting and query can be scaled and released on different schedules
  • The availability targets in the requirement are achievable rather than aspirational
What it costs
  • Dedicated capacity that is idle most of the time and is the first thing a cost review proposes merging back
  • Caching and authorisation are implemented twice
  • Two code paths onto the same store means two places a query-semantics change has to land
Choose differently when
If the query tier could be made genuinely isolated per workload class — hard multi-tenancy with guaranteed capacity per class — one tier with a reserved class would give the same guarantee more cheaply.
Why it holds up over time
The principle that the mechanism which raises the alarm must not share fate with the mechanism people are using is older than any of this software, and it is the first thing lost when a platform is optimised.
LessonWhatever must work during the incident should not share capacity with whatever everyone uses during the incident.
Shown on views10 19 25
ADR-18

Absence of signal is a first-class alert condition, driven by expected emission

Accepted

A service stops emitting. What tells anyone?

Context
To a threshold rule, a stopped exporter and a perfectly healthy service look identical: no data above the threshold. This is the failure class that looks like health, and it is the one that survives longest in production, because nobody investigates a quiet dashboard. It is also the failure class an observability platform is uniquely obliged to catch, since nobody else can.
Decision
The platform tracks expected emission per producer, derived from the service catalogue and from observed history, and alerts on absence as a condition distinct from any threshold. The same mechanism covers the platform's own silence through the dead-man switch in ADR-22. Absence alerts are owned by the producing team and are not suppressible without an expiring, recorded justification.
How it is realised on AWS
A per-service emission expectation is materialised from the catalogue and from a rolling observed baseline; a rule group evaluates absence over a window scaled to each service's normal cadence. A newly onboarded service gets its expectation from the catalogue before it has any history.
Options weighed
  • ChosenExpected emission from catalogue plus observed baseline: Catches the silent failure for services that have never been quiet and for ones that just launched. Costs a baseline to maintain and tune.
  • RejectedAbsence rules written per service by their teams: Precise where it is done. It will not be done for the services that most need it.
  • RejectedInfer from infrastructure health instead: No telemetry dependency. A healthy pod with a broken exporter is exactly the case that matters and is invisible this way.
  • DeferredAlert on ingest volume per team: Cheap and catches large regressions. Too coarse to notice one service in a team of forty going quiet.
Consequences
What it buys
  • The failure that looks like health has a detector
  • A broken instrumentation deploy is caught in minutes rather than at the next incident
  • The platform's own silence is covered by the same idea
What it costs
  • Services with genuinely bursty emission generate false absence alerts and are the hardest to baseline
  • This is the alert most likely to be tuned down for noise, which would remove the control entirely
  • A catalogue entry that is wrong produces an expectation that is wrong
Choose differently when
If every service emitted a synthetic heartbeat at a fixed cadence as a platform convention, absence detection becomes trivial and the baseline is unnecessary. That is a cheaper design and requires estate-wide discipline this one does not assume.
Why it holds up over time
Detecting silence is a permanent requirement of monitoring, and the techniques improve while the obligation does not change.
LessonEvery monitoring system alerts on things going up. The one that matters alerts on something that should be there and is not.
Shown on views21 25

Economics and governanceWho pays, who decides, and what the platform is allowed to refuse.

ADR-19

Chargeback with soft quotas, and a hard quota only on cardinality

Accepted

Is telemetry cost enforced as a limit, or attributed as a bill?

Context
A hard quota bounds the platform's spend absolutely and makes the platform the thing that dropped a team's data during their worst hour. A chargeback keeps all the data and turns cost into a conversation weeks later, by which time the labels are in production and the money is spent. The two failure modes are genuinely different in kind: one loses evidence, the other loses money. Cardinality is the exception, because an unbounded label is not merely expensive — it degrades the store for every other tenant.
Decision
Ingest volume, retention and query are attributed daily to owning teams with soft quotas that raise alerts and appear on scorecards, not rejections. Cardinality carries a hard quota at the gateway, because it is the one dimension where one team's excess is another team's outage. Incident-time raises to sampling rate and budgets are self-service, bounded by a per-team ceiling and an automatic expiry.
How it is realised on AWS
The usage meter writes bytes, active series, retained spans and query cost per team per day into the cost ledger, reconciled against the AWS Cost and Usage Report through Athena. Soft-quota breaches open a scorecard item; cardinality breaches are the enforcement events of ADR-06. Incident raises are an API call recorded with an actor and an expiry.
Options weighed
  • ChosenChargeback with soft quotas; hard only on cardinality: Never drops evidence for budget reasons, and still protects the shared store. Depends on the organisation acting on attributed cost.
  • RejectedHard quotas on all dimensions: Absolute spend control. The platform becomes the thing that dropped your data during your incident.
  • RejectedPure chargeback, no quotas at all: Simplest and most trusting. One cardinality incident becomes everyone's outage.
  • right elsewherePlatform absorbs the cost centrally, no attribution: Reasonable in a small organisation. At 70 teams it guarantees the bill is nobody's problem until it is everybody's.
Consequences
What it buys
  • An incident is never made worse by a budget control
  • The shared metric store is protected from a single team's mistake
  • Teams see the cost of a change at the moment they propose it
What it costs
  • Soft quotas only work if the organisation acts on attributed cost, which is a cultural bet
  • The platform's total spend is not bounded by construction, only steered
  • Incident raises are a real budget leak if the expiry is not enforced
Choose differently when
If attributed cost were repeatedly ignored and spend kept growing, hard quotas with a fast incident-time raise path become the necessary answer. This is the decision most likely to be revisited by circumstance rather than by argument.
Why it holds up over time
The tension between bounding cost and preserving evidence is permanent. Naming which dimension is a shared-resource problem and which is only a money problem is the part that transfers.
LessonEnforce hard limits only where one tenant's excess is another tenant's outage; everywhere else, send the bill.
Shown on views06 22
ADR-20

Query cost is charged to the reader, and unread data is the headline waste class

Accepted

Who pays for an expensive dashboard, and which reduction can actually be argued for?

Context
Producing teams have no control over who queries their data or how expensively. If query cost lands on the producer, the incentive is to emit less so that others cannot ask — exactly backwards. Meanwhile the only reduction that can be argued without guessing is the one supported by evidence, and the available evidence is what nobody reads: a service whose telemetry has not been queried in ninety days is paying for storage that has answered no question.
Decision
Query cost is attributed to the querying team, not the producing team. Last-queried statistics are maintained per service and per signal, and unread data is reported as the platform's primary waste class. Reduction proposals lead with unread data before they touch sampling rates or retention on data that is actually used.
How it is realised on AWS
The query frontend meters bytes scanned, object requests and compute per query and attributes them to the caller's team. Last-queried timestamps are maintained per service, signal and tier and surfaced on the monthly scorecard alongside cost.
Options weighed
  • ChosenReader pays; unread data is the waste class: Aligns the incentive with the action and gives cost reduction an evidence base. Costs per-query metering.
  • RejectedProducer pays for everything including queries: One bill per team, simple to compute. Rewards emitting less rather than emitting better.
  • right elsewhereQuery cost absorbed centrally: Removes friction from investigation, which has real value. Leaves the most expensive dashboards without an owner.
  • RejectedCut by retention and sampling across the board: Fast and even-handed. Cuts the data that answers questions at the same rate as the data nobody opens.
Consequences
What it buys
  • An expensive dashboard has a named owner
  • Cost reduction has an argument behind it rather than an across-the-board percentage
  • Producing teams are not penalised for being useful to others
What it costs
  • Charging for queries can discourage exactly the exploration the platform exists for, and needs a generous free allowance
  • Last-queried is a weak signal for data kept against an audit obligation, which is read approximately never and must be kept
  • Metering every query adds work to the read path
Choose differently when
If investigation were being suppressed by query cost, the right move is to absorb query cost centrally and keep only the attribution for visibility.
Why it holds up over time
Whoever causes a cost should see it. That principle does not age, even as the specific meters change.
LessonAttribute cost to the party whose behaviour you want to change, and reduce first where you have evidence rather than where it is easiest.
Shown on views06 21
ADR-21

The service catalogue is the front door, and an unclaimed producer is quarantined

Accepted

Where do ownership, budget, retention class and default dashboards come from?

Context
Every per-team mechanism in this architecture — budgets, chargeback, absence detection, access control, alert routing — needs to know who owns a service. Maintaining that inside the observability platform creates a second registry that diverges from the first within a quarter. Not maintaining it at all means onboarding becomes a platform-team ticket, which does not scale to 900 services and makes the journey in view 05 impossible.
Decision
The service catalogue is authoritative for ownership, environment, retention class and budget, and the platform syncs from it rather than holding its own copy. Onboarding is catalogue-driven: identity, defaults, dashboards and budgets are applied without a platform-team ticket. Telemetry from a producer with no catalogue entry is accepted into a low-budget quarantine tenant rather than into the general pool, so it is neither lost nor able to consume shared capacity.
How it is realised on AWS
A sync job reconciles the catalogue into Aurora on a schedule and on change events. Default dashboards and SLO scaffolding are generated per service from the catalogue entry. The quarantine tenant has a small fixed budget, short retention, and appears on an unclaimed-producers report.
Options weighed
  • ChosenCatalogue as the source of truth, quarantine for the unclaimed: One registry for the organisation, and no producer is silently dropped. Depends on the catalogue being real and maintained.
  • RejectedPlatform maintains its own ownership registry: No external dependency. Two registries, diverging, with the platform's one always the stale one.
  • RejectedReject telemetry from unknown producers: Enforces registration absolutely. Loses telemetry from exactly the unmanaged thing most likely to be the cause of an incident.
  • RejectedAccept everything into the general pool: Frictionless. Unowned telemetry consumes shared budget and cannot be billed, alerted on or cleaned up.
Consequences
What it buys
  • A new service is observable the day it ships with no platform-team involvement
  • Every per-team mechanism has one consistent source for who owns what
  • Unmanaged producers are visible and bounded instead of invisible or rejected
What it costs
  • The platform inherits the catalogue's data quality problems
  • A catalogue outage degrades onboarding and absence expectations, though not ingest or query
  • The quarantine tenant is a place things can sit forever unless the unclaimed report is acted on
Choose differently when
Without a credible catalogue, the platform would have to own a minimal ownership registry of its own — and should then treat it as a temporary liability with a plan to retire it.
Why it holds up over time
Service catalogues change shape and vendor, but the rule that the platform reads ownership rather than asserting it keeps the coupling one-directional and replaceable.
LessonConsume the organisation's source of truth rather than forking it, and give the records that do not fit a bounded home instead of the bin.
Shown on views05 10

Operations and assuranceRunning a platform that depends on the estate it observes, and releasing to 12,000 hosts nobody asked.

ADR-22

Self-telemetry runs in a separate account and region, on managed services

Accepted

The platform runs on the estate it observes. Who watches it?

Context
Self-observation is circular by construction: the platform's own metrics flow through its own pipeline into its own store and are alerted on by its own evaluator. Every one of those steps fails during the incidents that matter most, and the platform then reports itself healthy because nothing is arriving to say otherwise. Running a second copy of the same stack does not help if it shares an account, a region, an EKS control plane or a service limit.
Decision
A minimal self-telemetry and alerting path runs in a separate AWS account and region on managed services, sufficient to alert that the platform itself is blind. A heartbeat canary writes a probe through the full ingest path and reads it back through the full query path; a dead-man switch pages the platform team on silence. The stack shares no EKS control plane, no account limit and no scaling event with the platform it watches.
How it is realised on AWS
Amazon Managed Service for Prometheus and Amazon Managed Grafana in a separate account and region, receiving a small set of platform health, freshness and completeness series plus the canary's round-trip result. The dead-man switch alerts the paging platform directly when the heartbeat stops.
Options weighed
  • ChosenSeparate account and region, managed services: Independent of everything it watches, and small enough to be cheap. Costs a second bill and a second thing to keep alive.
  • RejectedSelf-monitor within the platform: Free and detailed. Blind exactly when it is needed, and confidently reports health.
  • RejectedA second self-hosted copy in another region of the same account: Full fidelity. Shares account limits, IAM, and usually the same bad deploy.
  • right elsewhereA third-party SaaS monitor: Genuinely independent and often the cheapest correct answer; rejected here only because the data would leave the estate.
Consequences
What it buys
  • The platform's blindness is detectable from somewhere that cannot go blind with it
  • The round-trip canary tests the whole path, not the components
  • The alert reaches the paging platform without traversing anything that is failing
What it costs
  • A second account, a second bill and a second stack to maintain for something that does almost nothing on a good day
  • It is the most likely line item to be cut in a cost review, which would silently remove the control
  • Deliberately low fidelity: it can say the platform is blind and very little about why
Choose differently when
If the paging platform itself offered a heartbeat-absence check, much of this could collapse into that, and the separate stack would only be needed for the round-trip probe.
Why it holds up over time
The circularity is structural for any observability platform on the infrastructure it observes. Whatever the technology, the answer is always somewhere with a different fate.
LessonA system cannot be the only witness to its own failure. Buy the smallest possible independent witness and protect it from the cost review.
Shown on views19 21
ADR-23

Config, rules and budgets are code with gates; agent rollouts ride rings

Accepted

How does a change to a collector pipeline, an alert rule or a budget reach production safely?

Context
The platform's configuration is more dangerous than its code. A collector pipeline change can silently stop a signal; a budget change can start rejecting a team's metrics; an agent release touches 12,000 hosts that no service team asked to have touched. None of these look like deployments in the usual sense, and all of them are.
Decision
Collector configuration, alert and SLO rules, budgets and retention classes live in Git and are released through a pipeline with gates: rules must read the complete path (ADR-03), a cardinality estimate runs before a metric reaches production, config is schema-validated and replayed against a recorded corpus, and a cost delta is previewed on the pull request. Environments progress staging, canary region, then waves. Agent releases roll out in rings of 1%, 10% and 100% of hosts, and config rollback is a single action.
How it is realised on AWS
Git as the source of truth with Argo CD applying per-region manifests. Rule unit tests run through the same evaluator as the ruler. Replay runs a recorded telemetry corpus through the candidate pipeline and diffs the output. Agent rings are node-group labels driving the DaemonSet update.
Options weighed
  • ChosenConfig as code with gates and rings: Configuration is treated as what it is. Costs a pipeline, a corpus and the discipline to keep the gates honest.
  • RejectedConsole-edited configuration with an audit log: Fast for the operator. No review, no test, no rollback, and a busy afternoon becomes an estate-wide outage.
  • RejectedCode for pipelines, console for rules: A common compromise. Rules are the part that decides whether anyone is paged, so they need the gates most.
  • RejectedAgent auto-update on release: Keeps the fleet current with no effort. Turns one bad build into 12,000 simultaneous failures.
Consequences
What it buys
  • The completeness boundary and the cardinality budget are enforced by the release process
  • Every change is reviewed, tested against a corpus, and revertible
  • An agent regression is caught at 1% of hosts
What it costs
  • Replay only catches what the corpus contains; an unrecorded signal shape passes every gate
  • Config rollback is one action, but rolling an agent back across 12,000 hosts is not
  • Gates add latency to urgent changes, which is a real cost during an incident
Choose differently when
In a small estate with a handful of collectors, console editing with an audit trail is proportionate and much faster.
Why it holds up over time
Configuration-as-code has outlived the tools that popularised it because the property it provides — review, test, revert — is what makes any change survivable.
LessonConfiguration that can stop a signal or start a page deserves the same pipeline as the code that emits it.
Shown on views20
ADR-24

Every plane fails static on control-plane loss, and never fails silent

Accepted

What happens to collection, evaluation and query when the control plane is unavailable?

Context
The control plane holds rules, budgets, retention classes and the catalogue mapping. It is the only non-derived state in the platform, and it is also the least critical to serving: nothing about ingesting a sample or evaluating a rule needs it to be reachable, provided the last-known values are held locally. The dangerous design is one where a control-plane lookup is in the serving path, because then a small store's outage becomes the platform's outage.
Decision
Collection, admission, storage, query and alert evaluation all hold last-known configuration locally and continue operating on it when the control plane is unavailable. Only changes are impossible. Nothing fails closed into silence: an evaluator with stale rules keeps evaluating and reports staleness, and a gateway with stale budgets keeps admitting under the last-known limits. The control plane is therefore allowed the weakest availability target in the platform at 99.5% monthly.
How it is realised on AWS
Every tier caches its configuration and refreshes on an interval, with the cached values marked with their age. Argo CD and Git provide a second source for recovery. Configuration staleness per tier is a reported metric, and a staleness threshold is itself an alert condition.
Options weighed
  • ChosenFail static everywhere, report staleness: The control plane is never in the serving path. Costs a cache in every tier and the risk of running on stale policy.
  • RejectedFail closed — stop admitting when policy cannot be read: Policy is never violated. A small store's outage becomes total telemetry loss.
  • RejectedFail open with no limits when policy is unreachable: Maximum availability. A control-plane outage becomes an unbounded cardinality and cost event.
  • RejectedReplicate the control plane into every tier as the source of truth: No staleness. Turns one consistent store into many, and configuration changes become a distributed-consensus problem.
Consequences
What it buys
  • The control plane can be maintained, migrated or lost without a serving incident
  • The availability targets are layered honestly, with the weakest where it matters least
  • Staleness is visible rather than assumed
What it costs
  • Running on stale budgets and classes can mean enforcing yesterday's policy for hours
  • A cache in every tier is a cache in every tier: another thing to invalidate, size and reason about
  • A long control-plane outage blocks urgent changes — including incident-time sampling raises
Choose differently when
If policy changes were safety-critical and had to take effect immediately — a privacy control rather than a budget — failing closed on unreachable policy becomes the right choice for that specific class.
Why it holds up over time
Fail-static is the standard answer wherever a control plane governs a data plane, and it becomes more important as the data plane grows relative to the control plane.
LessonKeep the store that holds your policy out of the path that serves your traffic, and make the age of what you are running on visible.
Shown on views10 25

Every package used, in one table

Every product and package named on the views, what it is, the job it does in this design, and what was considered instead.

PackageWhat it isWhat it does hereConsidered instead
OpenTelemetry Vendor-neutral standard and SDKs for metrics, logs and traces The only instrumentation interface the platform offers A proprietary agent library
OpenTelemetry Collector Pipeline process of receivers, processors and exporters Node agent and gateway tier; normalisation, redaction, admission, aggregation, path split Fluent Bit plus a separate metrics agent
ADOT AWS Distro for OpenTelemetry The supported collector build used on EKS and EC2 Upstream collector builds
Amazon MSK Managed Apache Kafka The durable ingest buffer and single replay point Kinesis Data Streams; self-managed Kafka
Grafana Mimir Horizontally scalable Prometheus-compatible metric store on object storage The complete path: all counting, rates, percentiles and alert evaluation Amazon Managed Service for Prometheus; Thanos
Grafana Tempo Trace store designed around object storage and trace-id lookup The retained evidence corpus for traces AWS X-Ray; Jaeger with a Cassandra backend
ClickHouse Columnar analytical database Log storage and high-cardinality exploratory group-by Amazon OpenSearch Service; Grafana Loki
Amazon S3 Object storage with lifecycle and storage classes The retention substrate for every long-lived signal Cluster-local NVMe with replication
S3 Object Lock Write-once retention enforced by the storage service Immutability for the seven-year compliance class Application-enforced retention
S3 Glacier Instant Retrieval Low-cost storage class with millisecond first-byte latency The 400-day cold log tier behind rehydration Discarding raw logs after 30 days
Amazon DynamoDB Managed key-value store The exemplar index — the only join between the two planes A relational index; query-time attribute joins
Amazon Athena Serverless SQL over data in S3 Query of rehydrated cold partitions and cost reconciliation against the CUR Spinning up a transient query cluster
Amazon Managed Grafana Managed Grafana workspaces with SAML integration Consoles, dashboards and the exemplar pivot Self-hosted Grafana on EKS
Amazon Managed Prometheus Managed Prometheus-compatible store Self-telemetry in the separate witness account A second self-hosted Mimir
Aurora PostgreSQL Managed relational database The control plane: catalogue, budgets, rules, SLOs, cost ledger Holding configuration in the metric store
Argo CD GitOps continuous delivery for Kubernetes Applies collector config, rules and budgets per region from Git Console editing; a bespoke config service
EKS Pod Identity Per-pod IAM role association on EKS The workload identity that resource attribution is derived from IRSA; shared node roles; API keys
AWS PrivateLink Private connectivity between VPCs and services The only ingest path for in-house telemetry A public authenticated endpoint
AWS KMS Managed key service Keys held outside the platform; crypto-shred as a last-resort deletion Keys managed by each store
IAM Identity Center Workforce SSO with SAML and MFA Human access to consoles and query, with authority from group membership Local accounts per tool
Open svg/<view>.svg or drawio/<view>.drawio in draw.io Desktop or at app.diagrams.net to edit. The SVG carries the diagram inside it, so it is both the picture and the source. This folder is self-contained — copy it whole and every link still resolves.