Observability Platform  ·  View 04 of 25  ·  People and journeys

Journey — Page to Root Cause

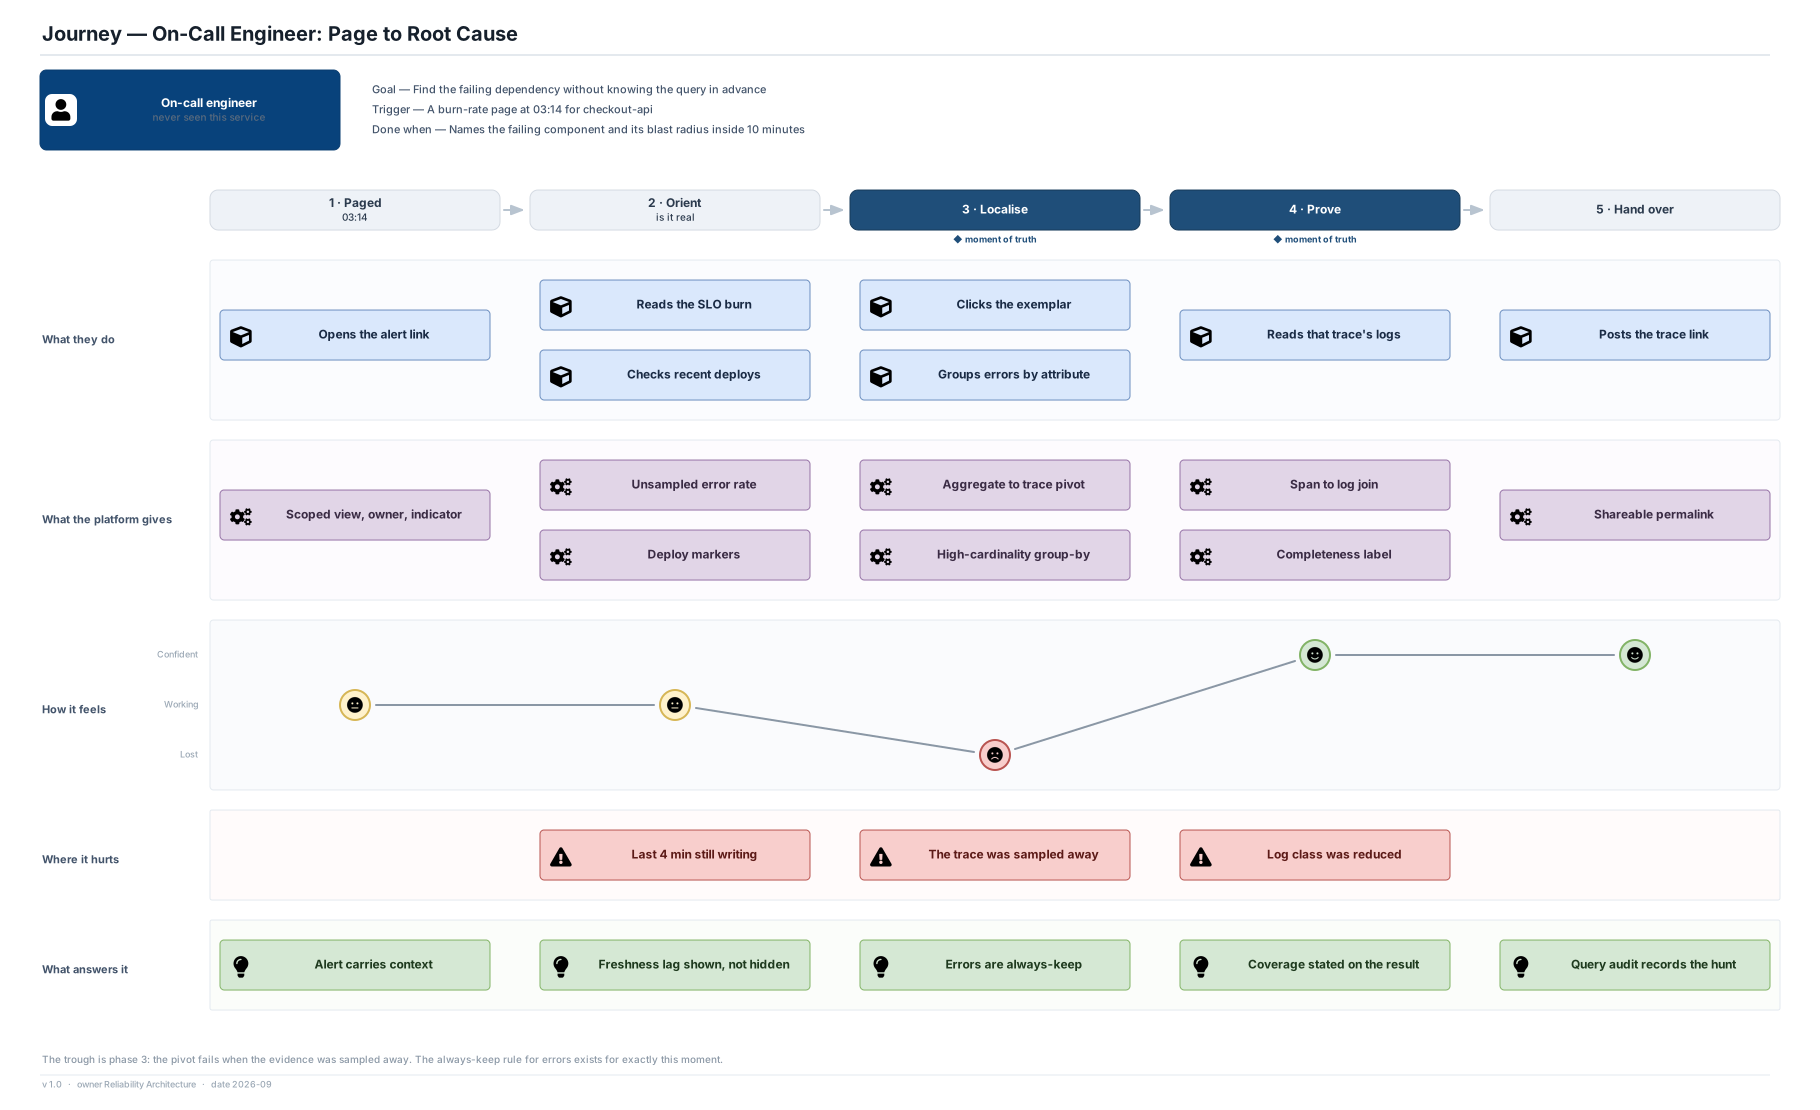
The journey the whole platform exists for, and the phase where it fails.

Editable source SVG draw.io All views
On-call engineer never seen this service Goal — Find the failing dependency without knowing the query in advance Trigger — A burn-rate page at 03:14 for checkout-api Done when — Names the failing component and its blast radius inside 10 minutes 1 · Paged 03:14 2 · Orient is it real 3 · Localise ◆ moment of truth 4 · Prove ◆ moment of truth 5 · Hand over What they do Opens the alert link Reads the SLO burn Checks recent deploys Clicks the exemplar Groups errors by attribute Reads that trace's logs Posts the trace link What the platform gives Scoped view, owner, indicator Unsampled error rate Deploy markers Aggregate to trace pivot High-cardinality group-by Span to log join Completeness label Shareable permalink How it feels Confident Working Lost Where it hurts Last 4 min still writing The trace was sampled away Log class was reduced What answers it Alert carries context Freshness lag shown, not hidden Errors are always-keep Coverage stated on the result Query audit records the hunt Journey — On-Call Engineer: Page to Root Cause The trough is phase 3: the pivot fails when the evidence was sampled away. The always-keep rule for errors exists for exactly this moment. v 1.0 · owner Reliability Architecture · date 2026-09

The trough is the finding

  • Sentiment drops at Localise, not at Paged. The engineer is fine until the pivot fails — until the chart says there was a spike and there is no trace behind it because it was sampled away.
  • That single moment is why errors, slow requests and debug-flagged traces are always-keep rules rather than sampling weights, and why the keep rules carry a per-service ceiling so they cannot become an unbounded ingest path.

What the platform owes each phase

  • Paged: the alert carries owner, indicator, recent history and a scoped view — the engineer never starts at a blank dashboard.
  • Orient: the freshness lag is shown, so "the errors stopped" and "the last four minutes have not been written" are never confused.
  • Prove: every result is labelled with its coverage, sampling rate and the tiers consulted.

Assumptions

  • Ten minutes from page to named component is the target this journey is designed against. It is a stated assumption, not a measured baseline, and should be replaced by the real MTTL within two quarters of launch.