Observability Platform  ·  View 11 of 25  ·  Structure

Integration Surface

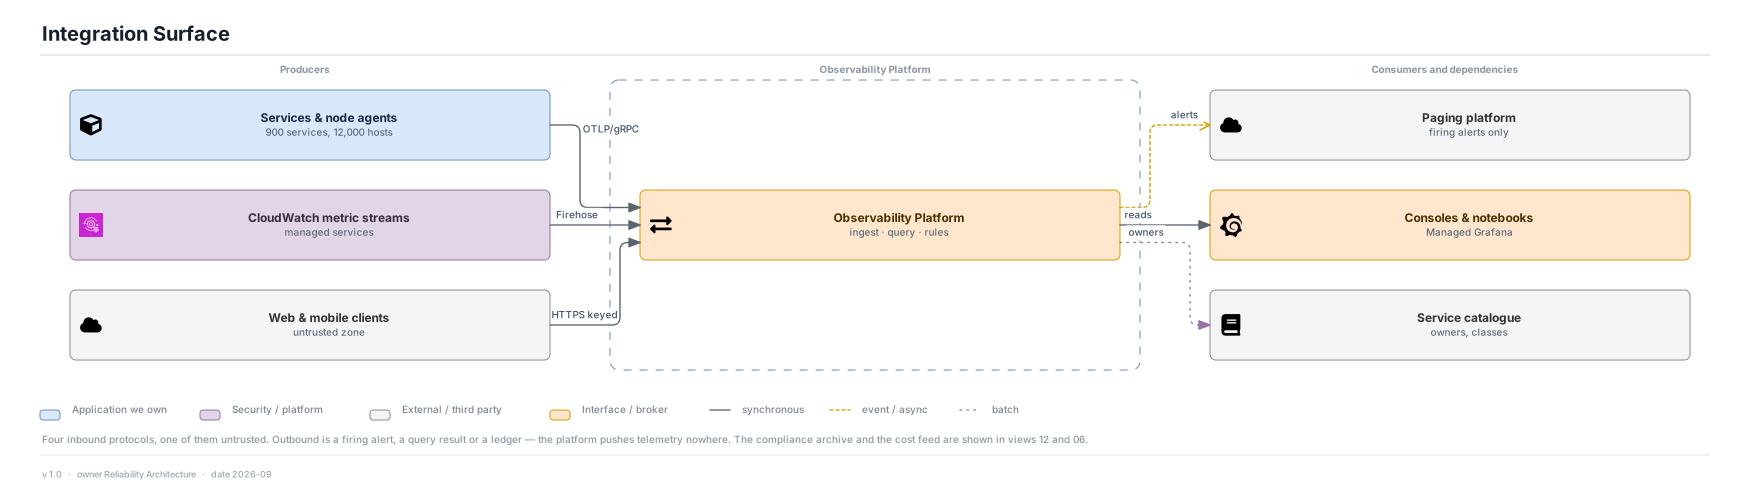
Four ways in, three ways out, and one of the four is untrusted.

Editable source SVG draw.io All views
Producers Services & node agents 900 services, 12,000 hosts CloudWatch metric streams managed services Web & mobile clients untrusted zone Observability Platform Observability Platform ingest · query · rules Consumers and dependencies Paging platform firing alerts only Consoles & notebooks Managed Grafana Service catalogue owners, classes OTLP/gRPC Firehose HTTPS keyed alerts reads owners Integration Surface Application we own Security / platform External / third party Interface / broker synchronous event / async batch Four inbound protocols, one of them untrusted. Outbound is a firing alert, a query result or a ledger — the platform pushes telemetry nowhere. The compliance archive and the cost feed are shown in views 12 and 06. v 1.0 · owner Reliability Architecture · date 2026-09

Decisions

  • One open instrumentation standard inbound. The platform does not offer a proprietary library, so a service can be observed without linking anything the platform owns.
  • The platform pushes telemetry nowhere. Everything outbound is a firing alert, a query result or a ledger — which is what keeps it out of the analytics and audit conversations in view 01.

Assumptions

  • Managed AWS service metrics arrive through CloudWatch metric streams rather than by polling the API, because polling 40,000 resources is its own cardinality and cost problem.

Deliberately omitted

  • The compliance archive and the daily cost feed are real interfaces and are shown in views 12 and 06 instead, to keep this view at four inbound and three outbound.