Observability Platform  ·  View 17 of 25  ·  Runtime

Critical Flow — The Pivot

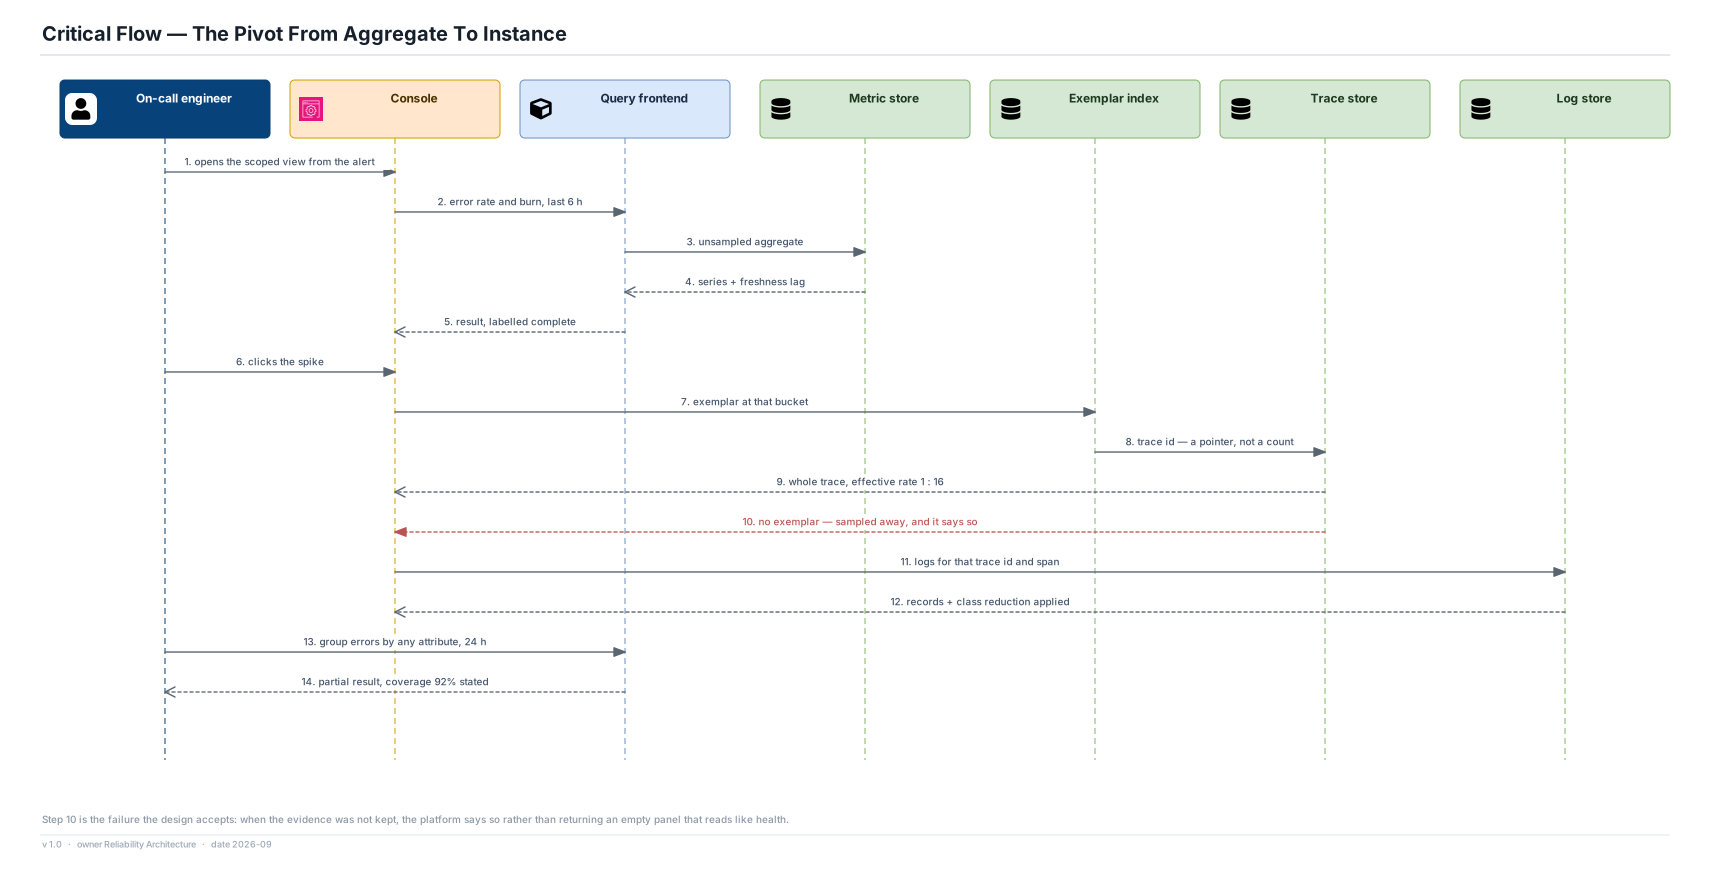
From a spike on a chart to the log line behind it, and what happens when the evidence was not kept.

Editable source SVG draw.io All views
On-call engineer Console Query frontend Metric store Exemplar index Trace store Log store 1. opens the scoped view from the alert 2. error rate and burn, last 6 h 3. unsampled aggregate 4. series + freshness lag 5. result, labelled complete 6. clicks the spike 7. exemplar at that bucket 8. trace id — a pointer, not a count 9. whole trace, effective rate 1 : 16 10. no exemplar — sampled away, and it says so 11. logs for that trace id and span 12. records + class reduction applied 13. group errors by any attribute, 24 h 14. partial result, coverage 92% stated Critical Flow — The Pivot From Aggregate To Instance Step 10 is the failure the design accepts: when the evidence was not kept, the platform says so rather than returning an empty panel that reads like health. v 1.0 · owner Reliability Architecture · date 2026-09

What the sequence proves

  • The exemplar index is the only join between the complete and sampled planes, and it moves a pointer, never a quantity.
  • Step 10 is the failure the design accepts and states: when the trace was sampled away, the platform says so. An empty panel that reads like health is the one outcome that is not allowed.
  • Step 14 returns a partial result with coverage stated rather than timing out, because a high-cardinality group-by that fails silently teaches an engineer to stop asking.

Budget

  • Dashboard panel over 24 h: p95 ≤ 2 s. Trace by id: p95 ≤ 1.5 s. Log search over 7 days: p95 ≤ 15 s. High-cardinality group-by over 24 h: p95 ≤ 25 s.

Risks

  • Four stores answer one investigation, each with its own latency and its own completeness. Stitching them into one honest coverage statement is the hardest part of the query layer and the place a federated design pays for itself or does not — ADR-09.