Observability Platform  ·  View 19 of 25  ·  Operations

Deployment Architecture

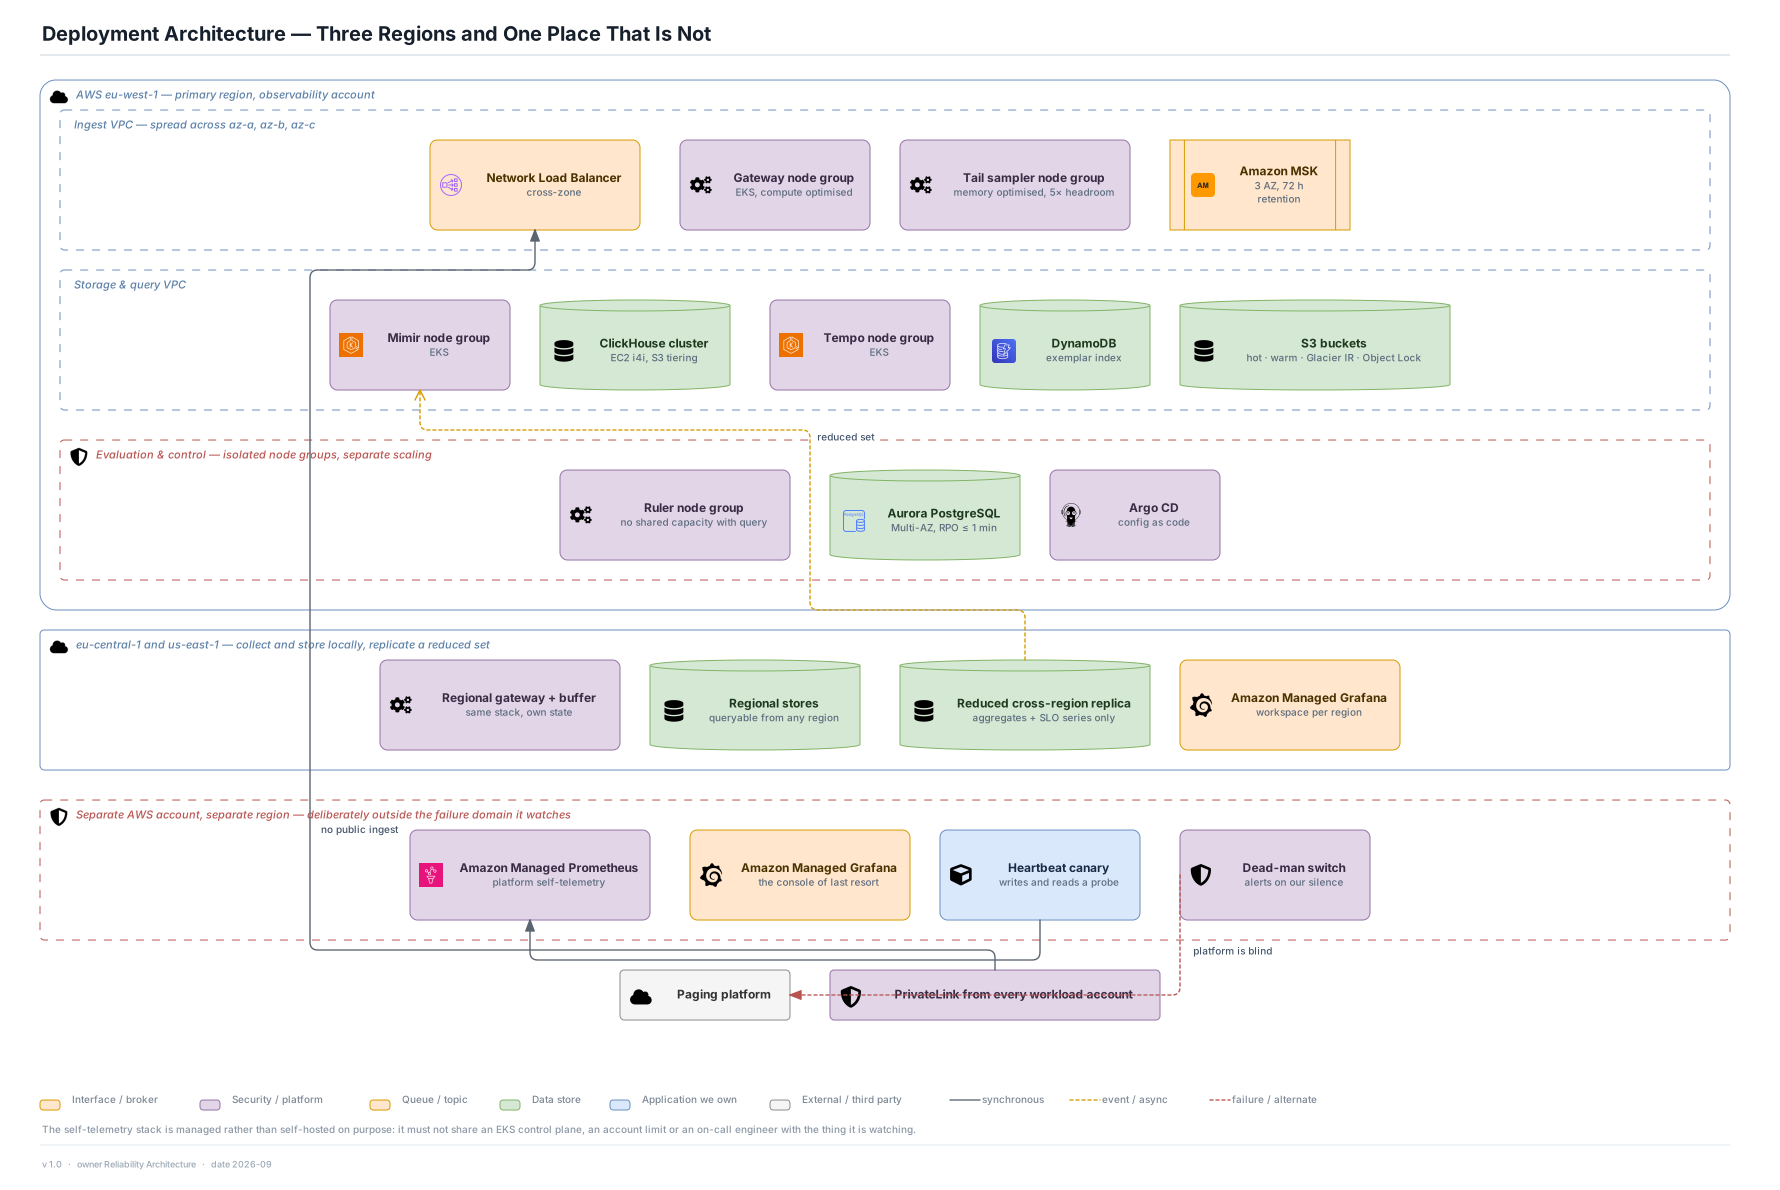
Three regions that collect and store locally, and one account deliberately outside the failure domain.

Editable source SVG draw.io All views
AWS eu-west-1 — primary region, observability account Ingest VPC — spread across az-a, az-b, az-c Network Load Balancer cross-zone Gateway node group EKS, compute optimised Tail sampler node group memory optimised, 5× headroom Amazon MSK 3 AZ, 72 h retention Storage & query VPC Mimir node group EKS ClickHouse cluster EC2 i4i, S3 tiering Tempo node group EKS DynamoDB exemplar index S3 buckets hot · warm · Glacier IR · Object Lock Evaluation & control — isolated node groups, separate scaling Ruler node group no shared capacity with query Aurora PostgreSQL Multi-AZ, RPO ≤ 1 min Argo CD config as code eu-central-1 and us-east-1 — collect and store locally, replicate a reduced set Regional gateway + buffer same stack, own state Regional stores queryable from any region Reduced cross-region replica aggregates + SLO series only Amazon Managed Grafana workspace per region Separate AWS account, separate region — deliberately outside the failure domain it watches Amazon Managed Prometheus platform self-telemetry Amazon Managed Grafana the console of last resort Heartbeat canary writes and reads a probe Dead-man switch alerts on our silence Paging platform PrivateLink from every workload account no public ingest reduced set platform is blind Deployment Architecture — Three Regions and One Place That Is Not Interface / broker Security / platform Queue / topic Data store Application we own External / third party synchronous event / async failure / alternate The self-telemetry stack is managed rather than self-hosted on purpose: it must not share an EKS control plane, an account limit or an on-call engineer with the thing it is watching. v 1.0 · owner Reliability Architecture · date 2026-09

Decisions

  • Each region collects and stores locally and replicates only a reduced set — aggregates and SLO series — so a region loss costs detail for that region and nothing else.
  • The self-telemetry stack runs in a separate account and region on managed services, so it shares no EKS control plane, no account limit and no scaling event with the platform it watches.
  • Ingest is reachable only through PrivateLink from workload accounts. There is no public ingest path for in-house telemetry.

Sizing notes

  • The tail sampler gets its own memory-optimised node group sized at 5× burst headroom; the ruler gets its own node group with no shared capacity with query.
  • MSK spans three AZs with 72 h retention — the single most consequential capacity number in the deployment.

Risks

  • The self-telemetry account is a second bill for a stack that does almost nothing on a good day, and is the most likely thing to be cut. Without it the circular dependency in view 01 is unanswered.
  • Cross-region query of the full corpus is deliberately not offered. An investigation spanning regions gets aggregates from the far region and must be opened there for detail.