Observability Platform · View 14 of 25 · Data
Decisions
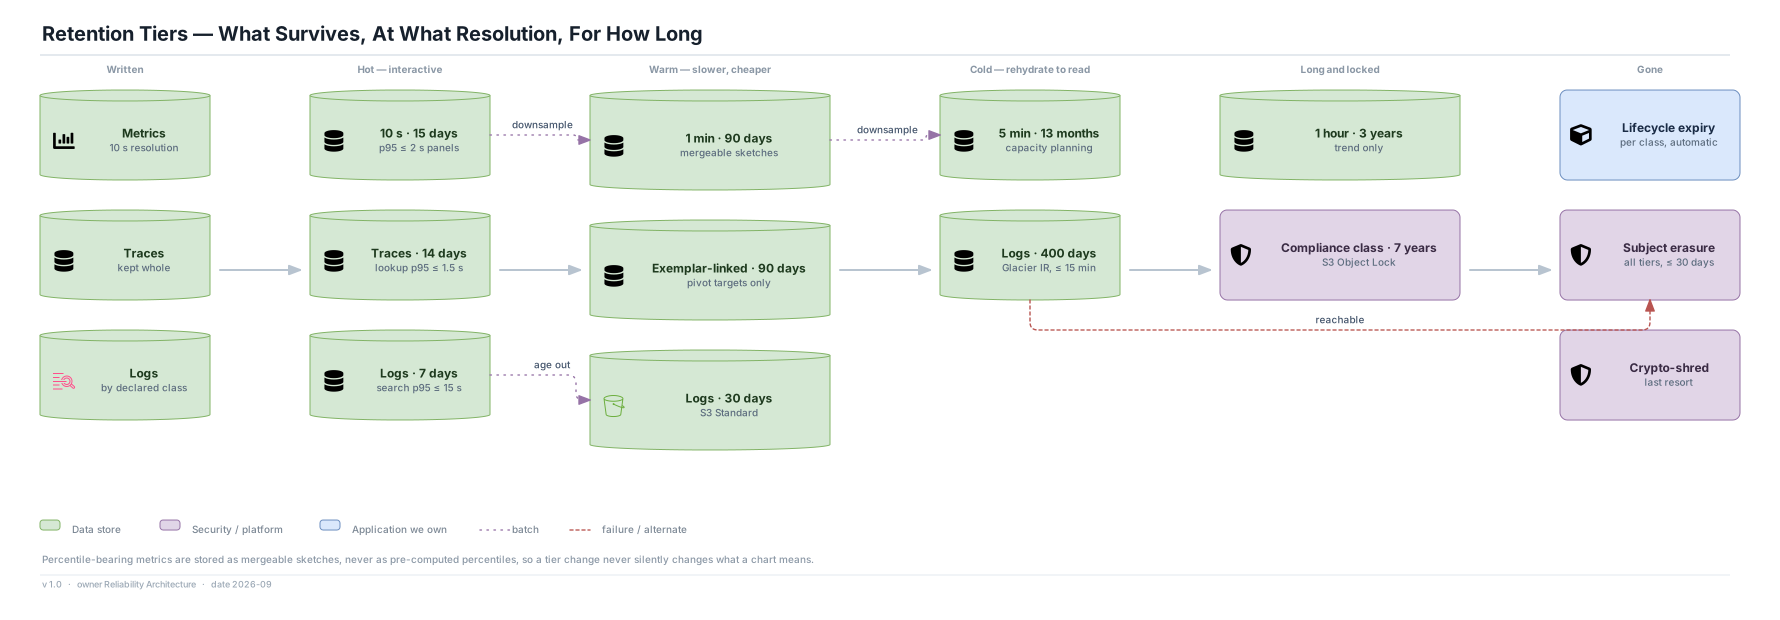
- Percentile-bearing metrics are stored as mergeable sketches, never as pre-computed percentiles, so re-aggregation across a tier boundary is still correct and a chart cannot silently change meaning as it ages.
- The resolution of any returned series is stated in the response. A 5-minute point and a 10-second point look identical on a chart and mean different things.
- The cold tier is rehydrated rather than queried in place. It is explicitly not an incident tool — 15 minutes is useful to an auditor and useless at 03:14.
Numbers (assumptions)
- Metrics: 10 s for 15 days, 1 min for 90 days, 5 min for 13 months, 1 hour for 3 years.
- Logs: hot 7 days, warm 30 days, cold 400 days; compliance class 7 years under Object Lock. Traces: 14 days, exemplar-linked 90 days.
- Every one of these is invented to be defensible and arguable. The 400-day log figure is the weakest and the most expensive: it exists to cover a year-over-year comparison nobody has yet asked for.
Risks
- Cold-with-rehydration preserves questions nobody anticipated at a storage cost that grows forever. Downsample-and-discard is bounded and forecloses them permanently. This set commits to the first and leaves the bet visible in ADR-15.