37 views, in reading order. Every view ships three ways: an HTML page, an SVG that re-opens in diagrams.net fully editable, and draw.io source.
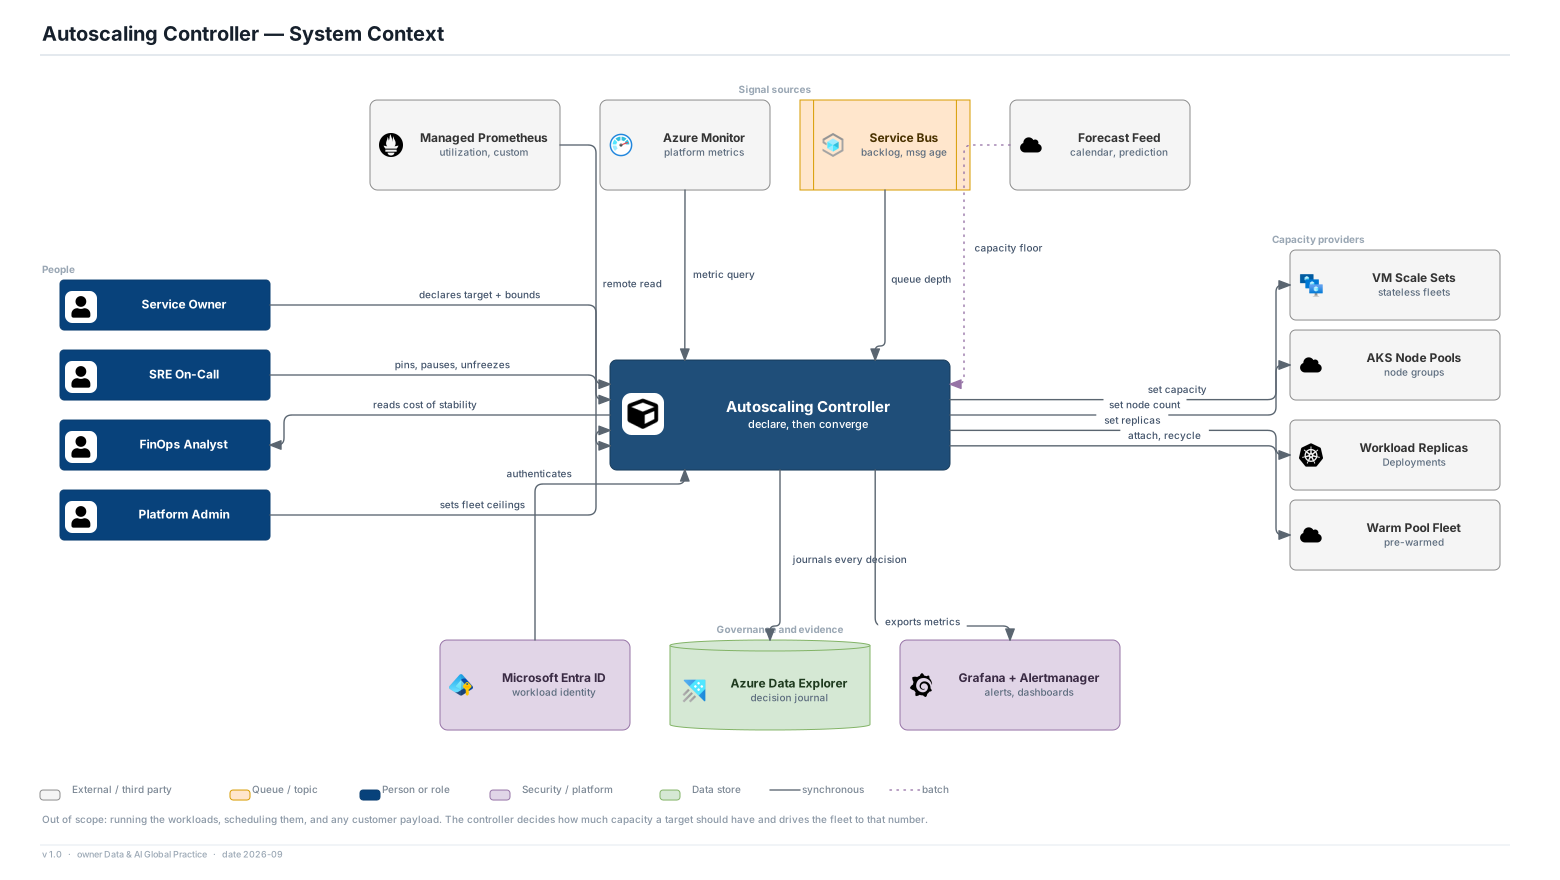
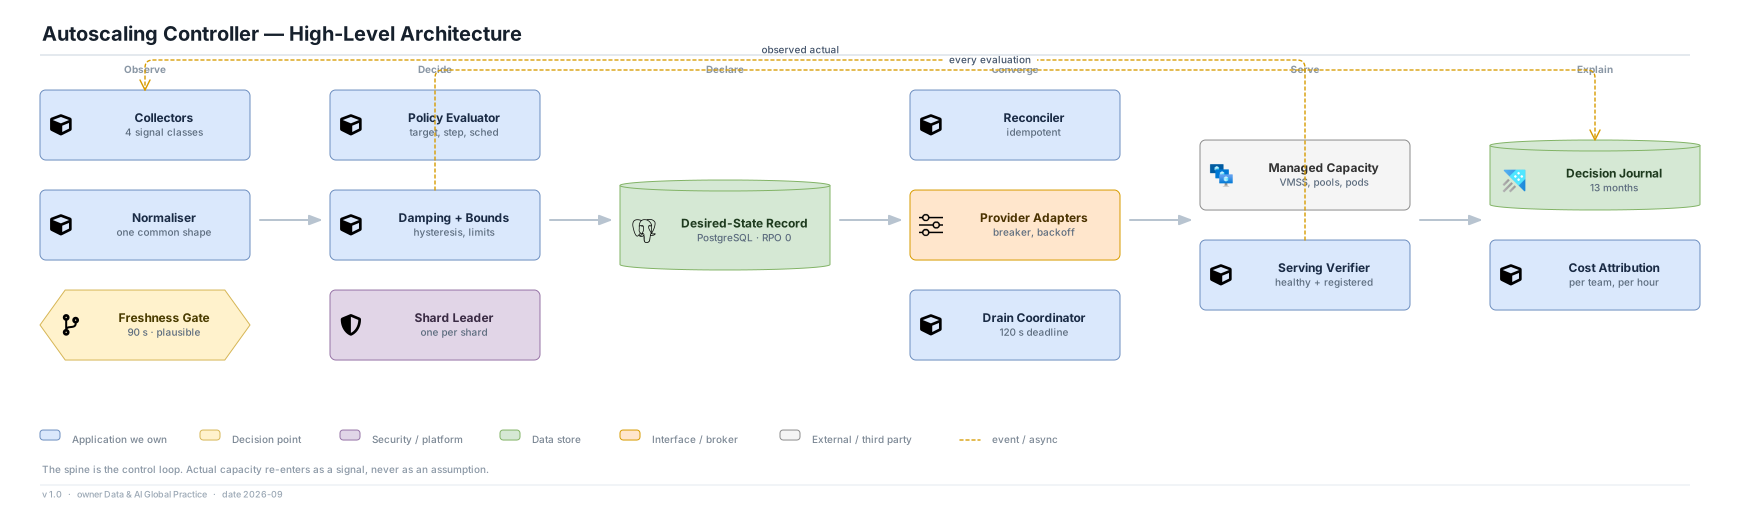
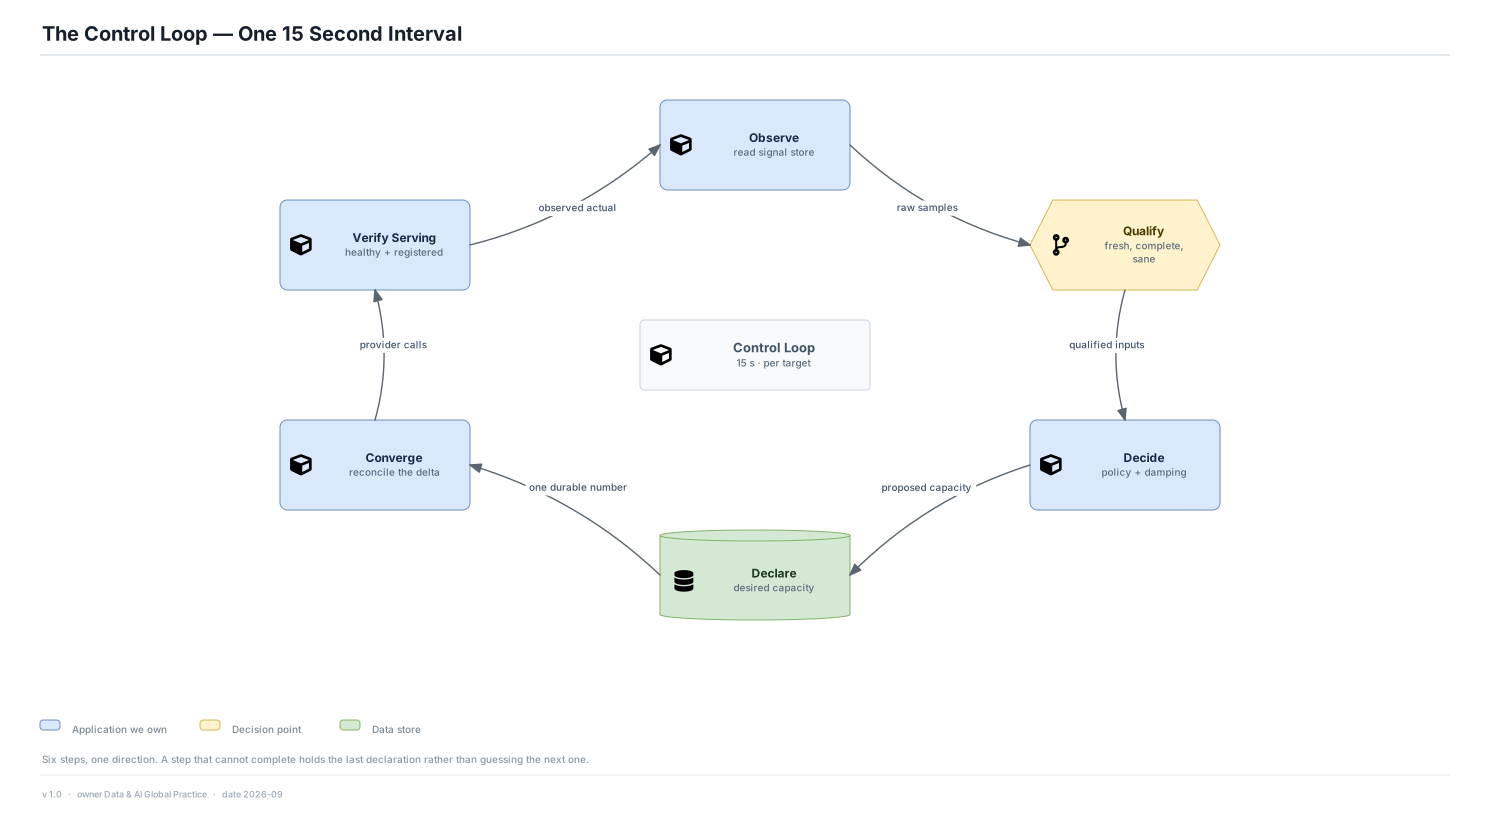
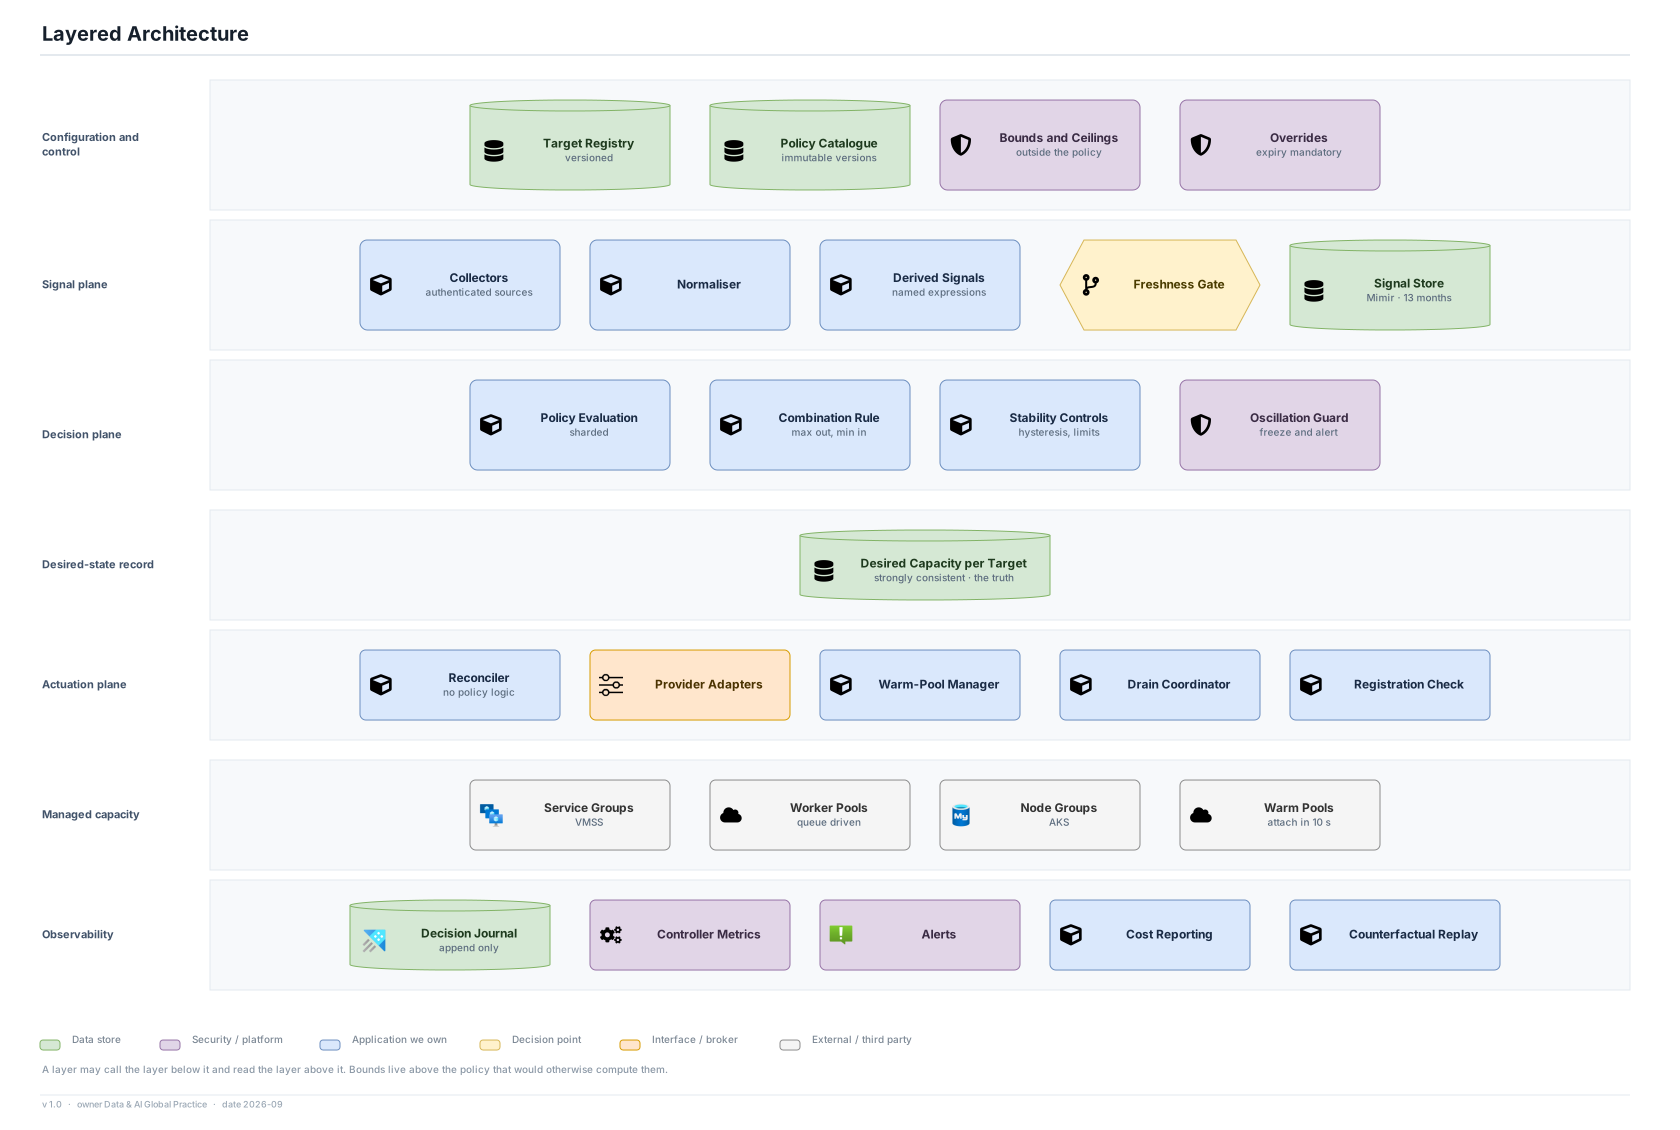
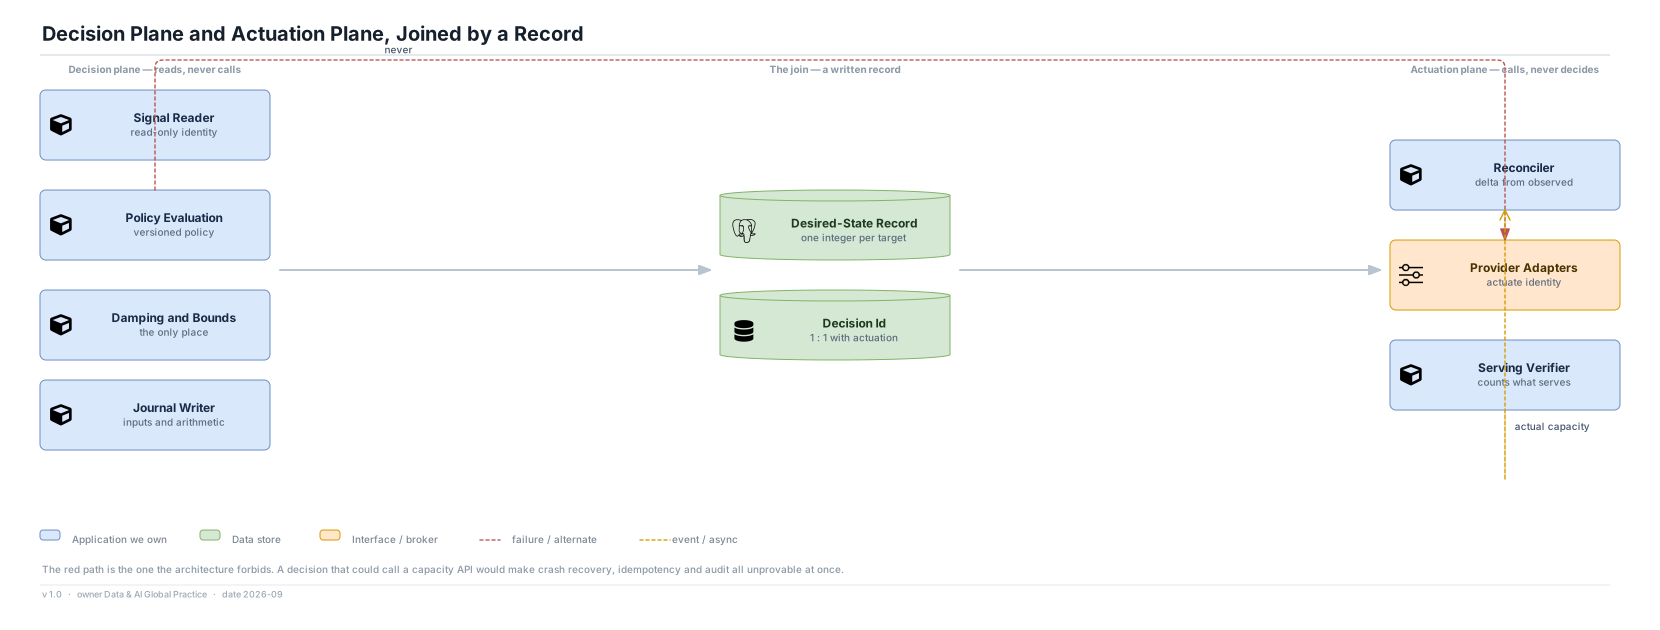
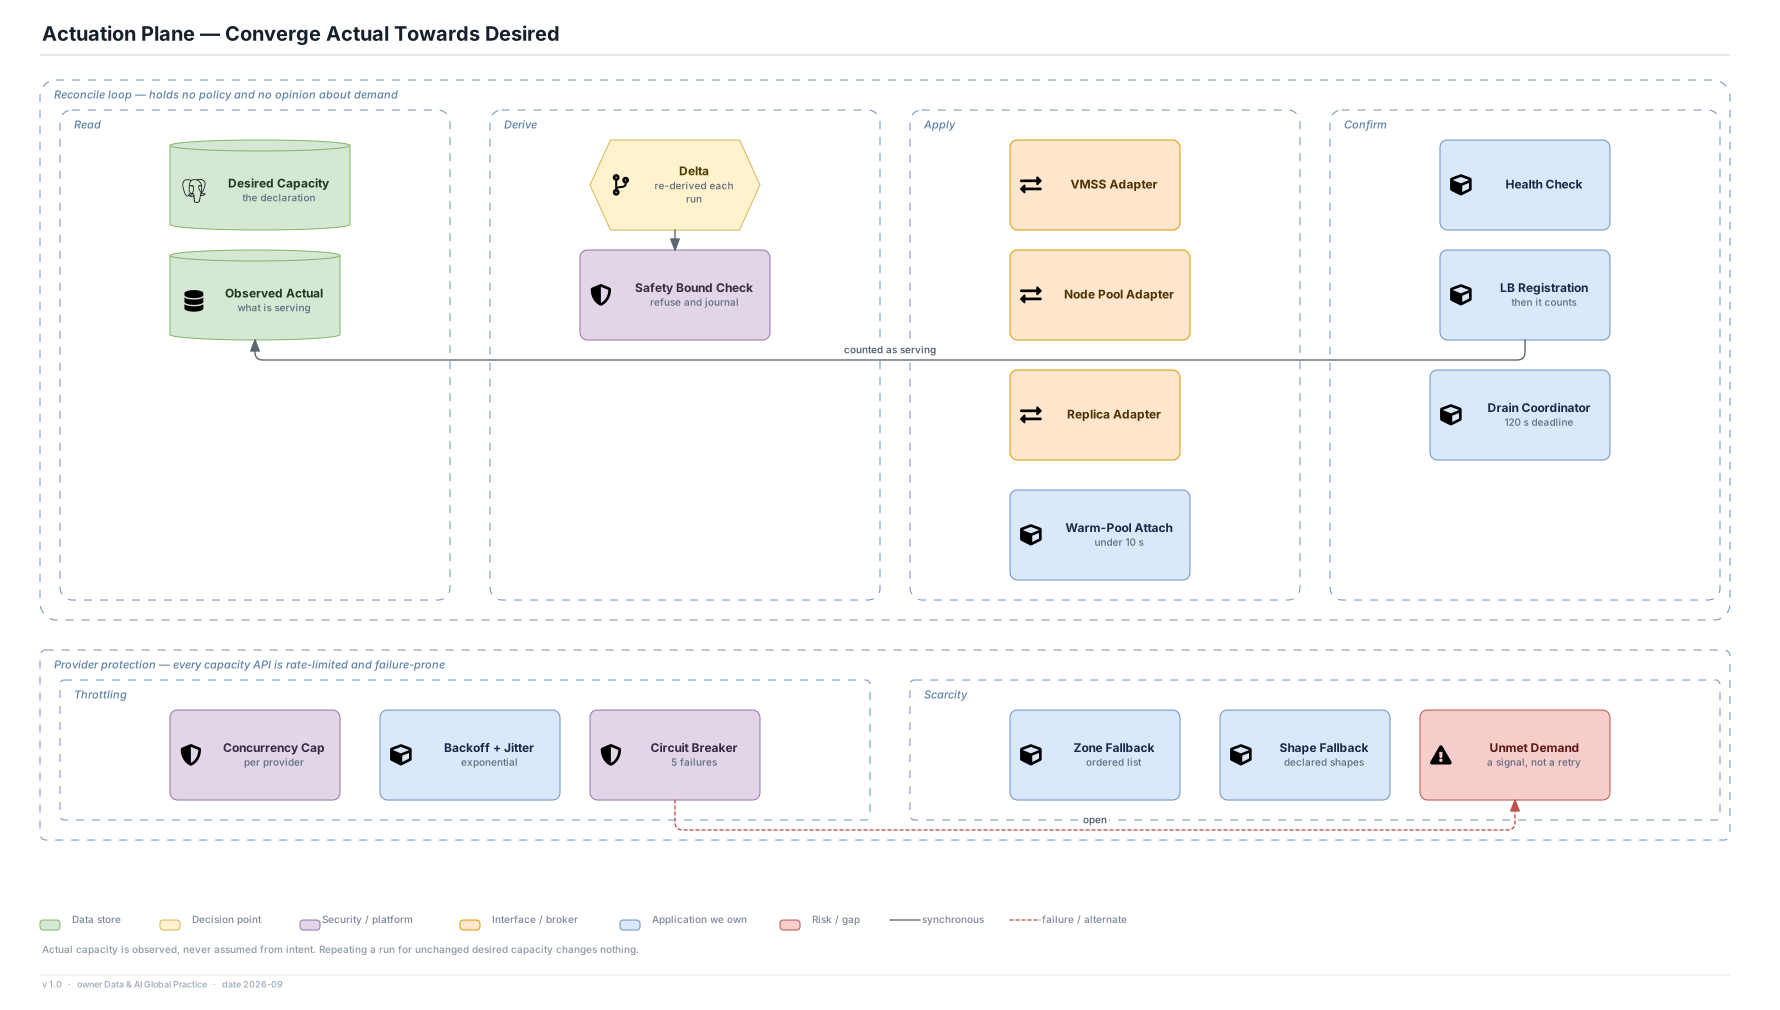
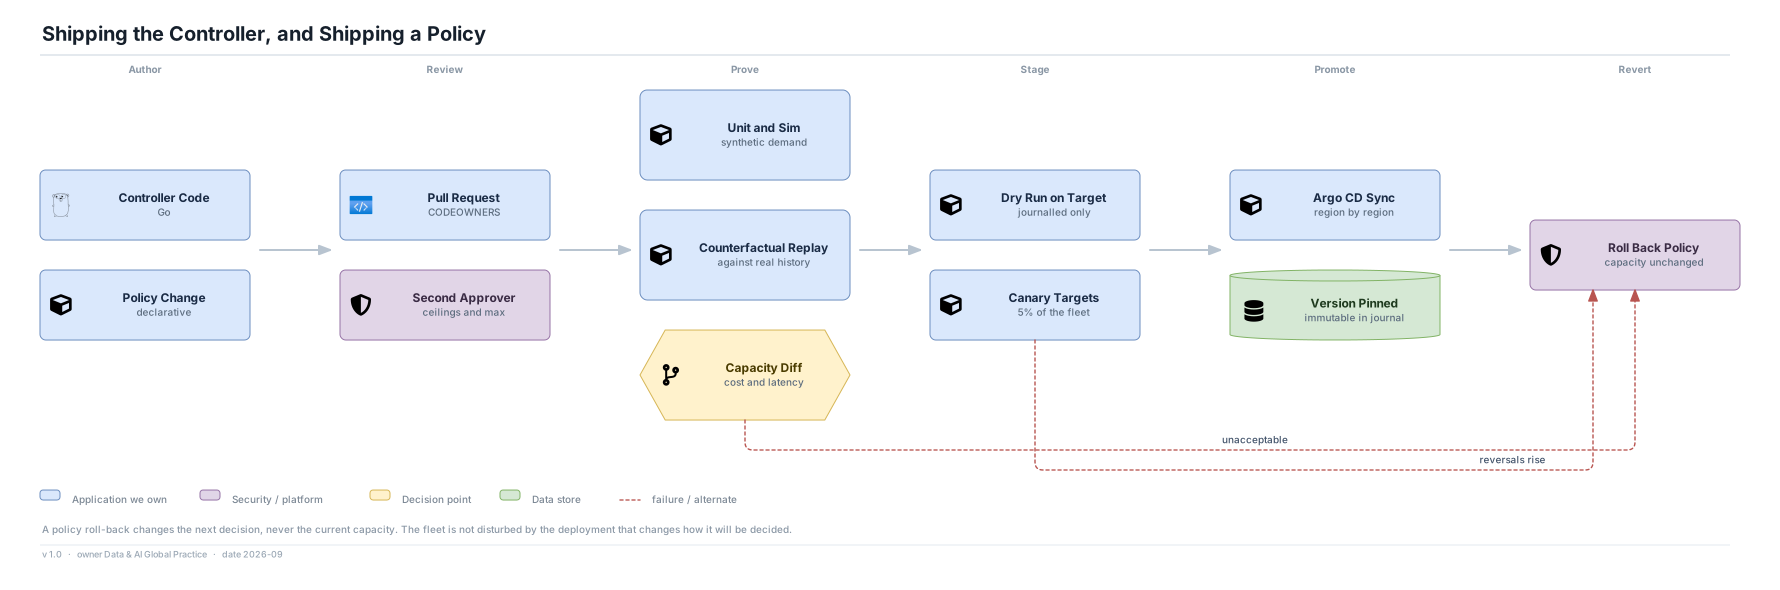
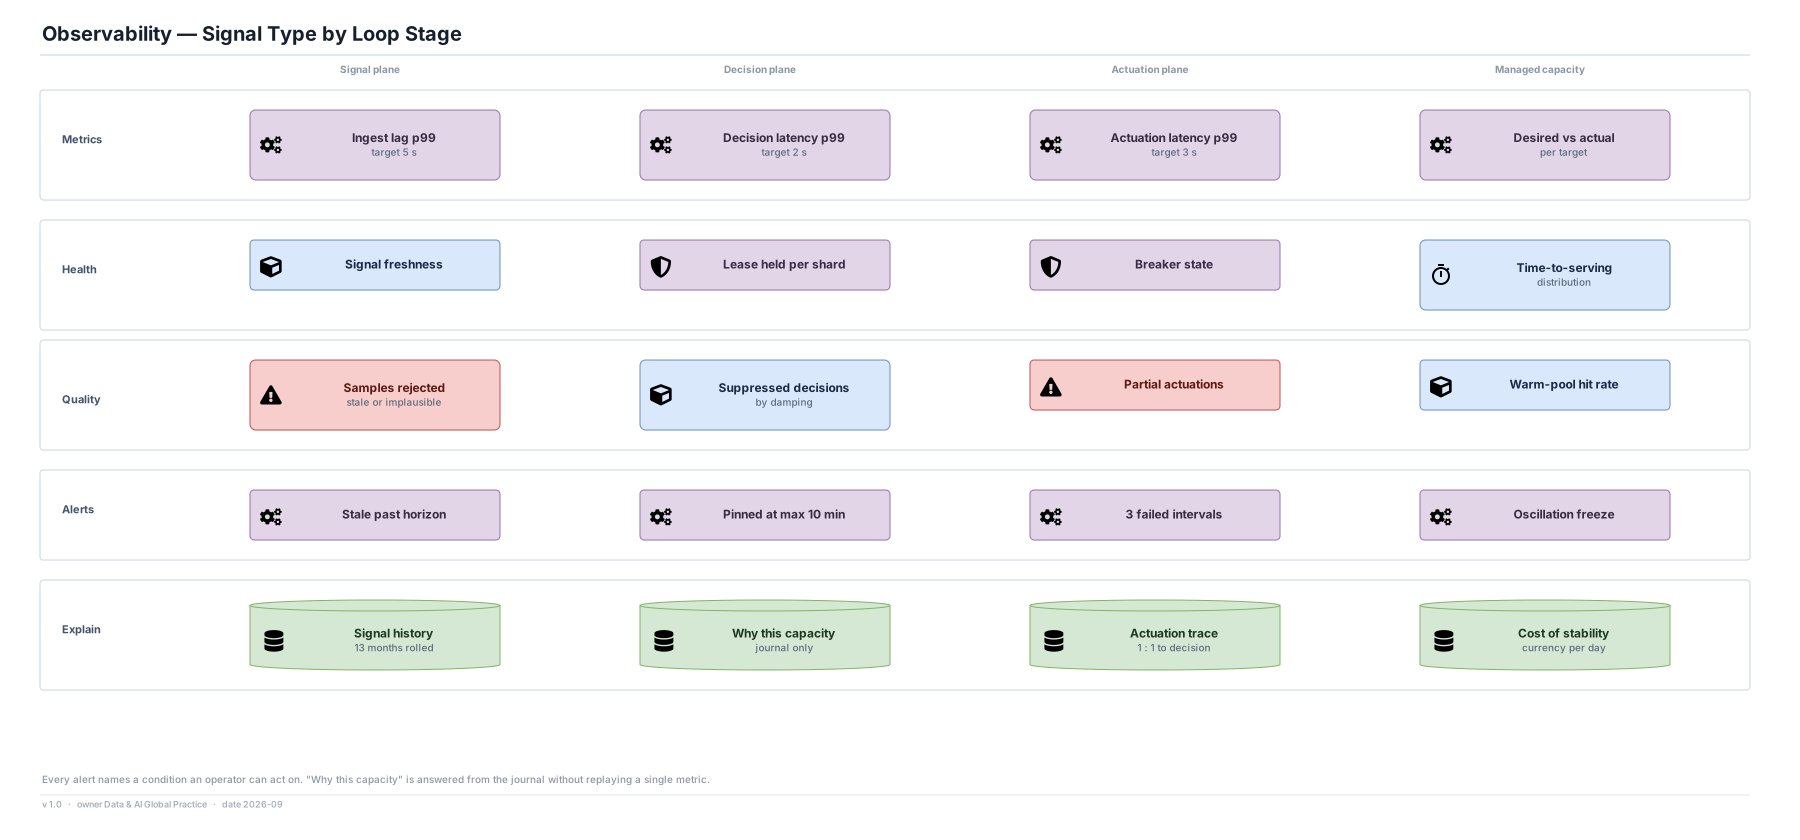
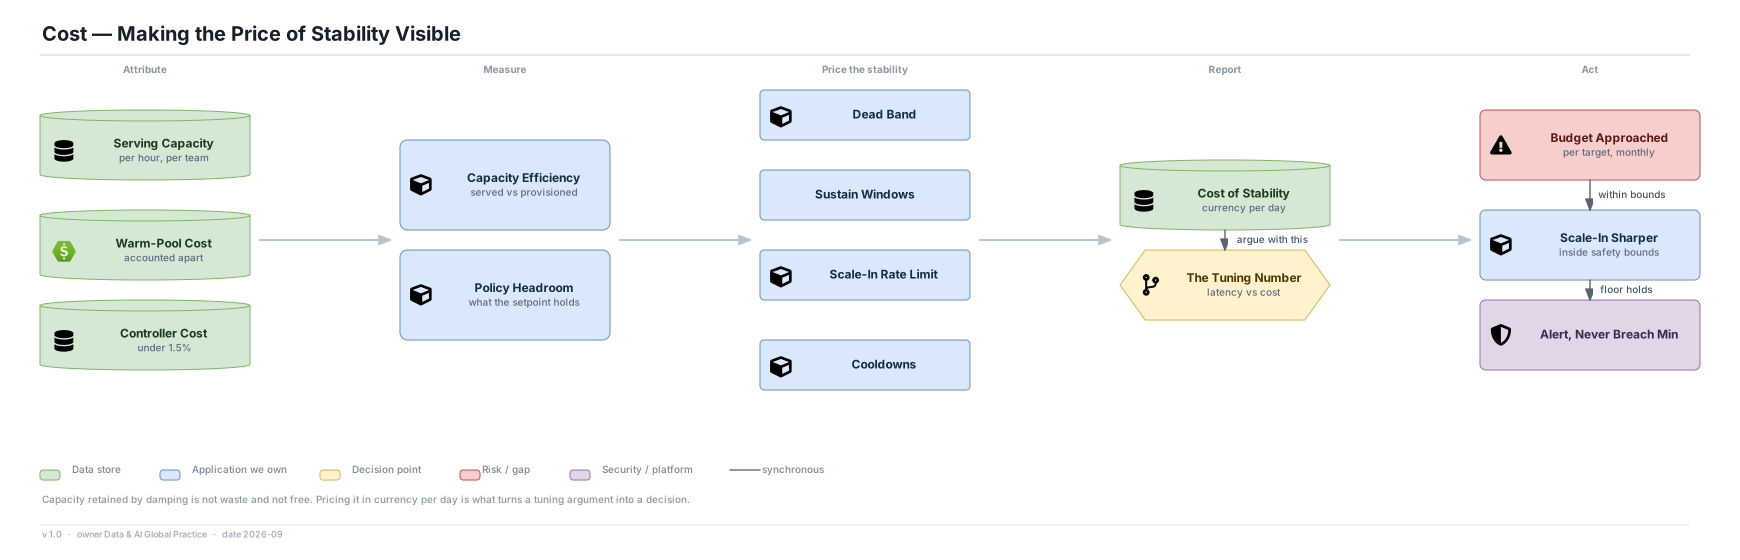
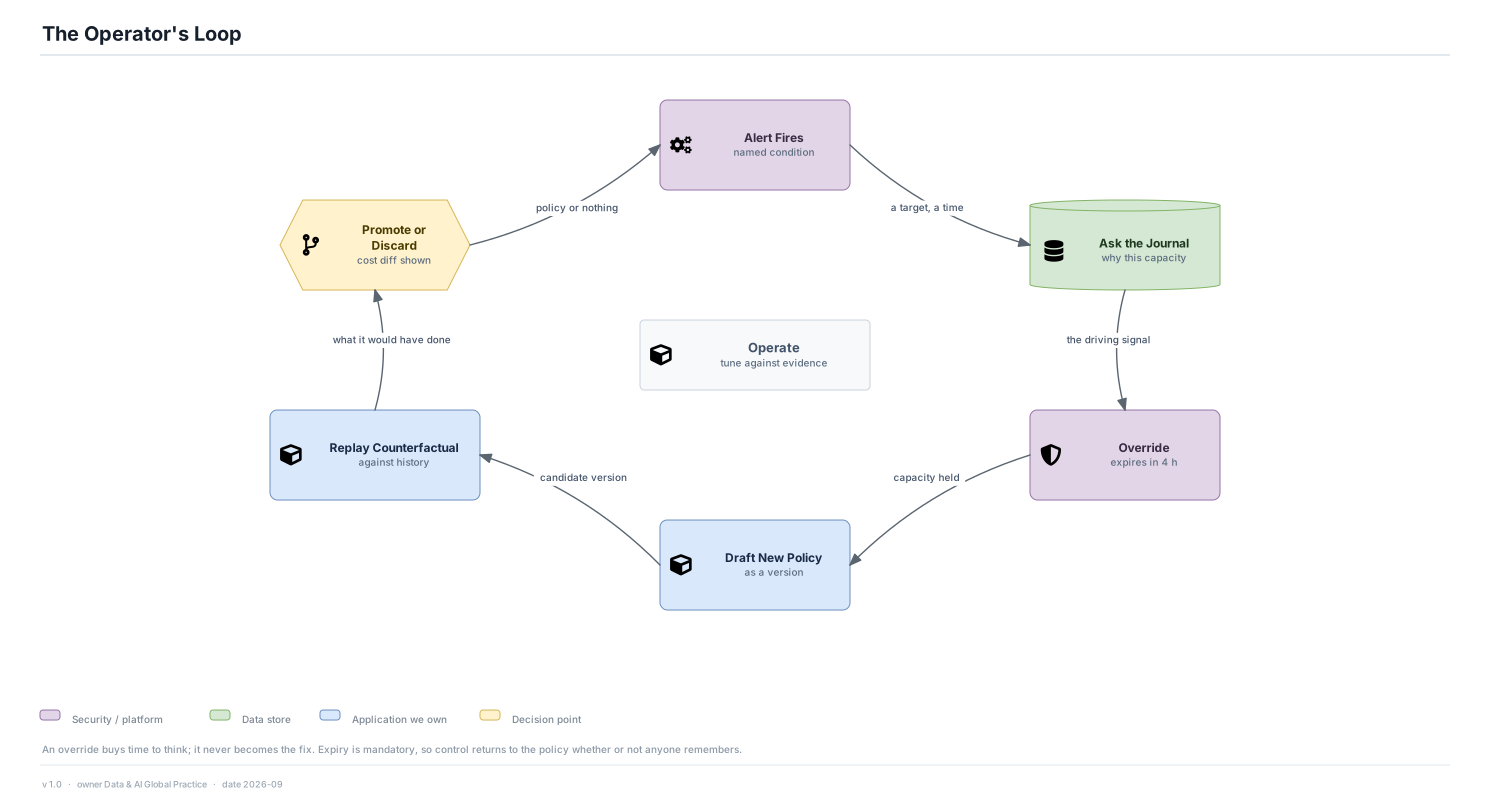
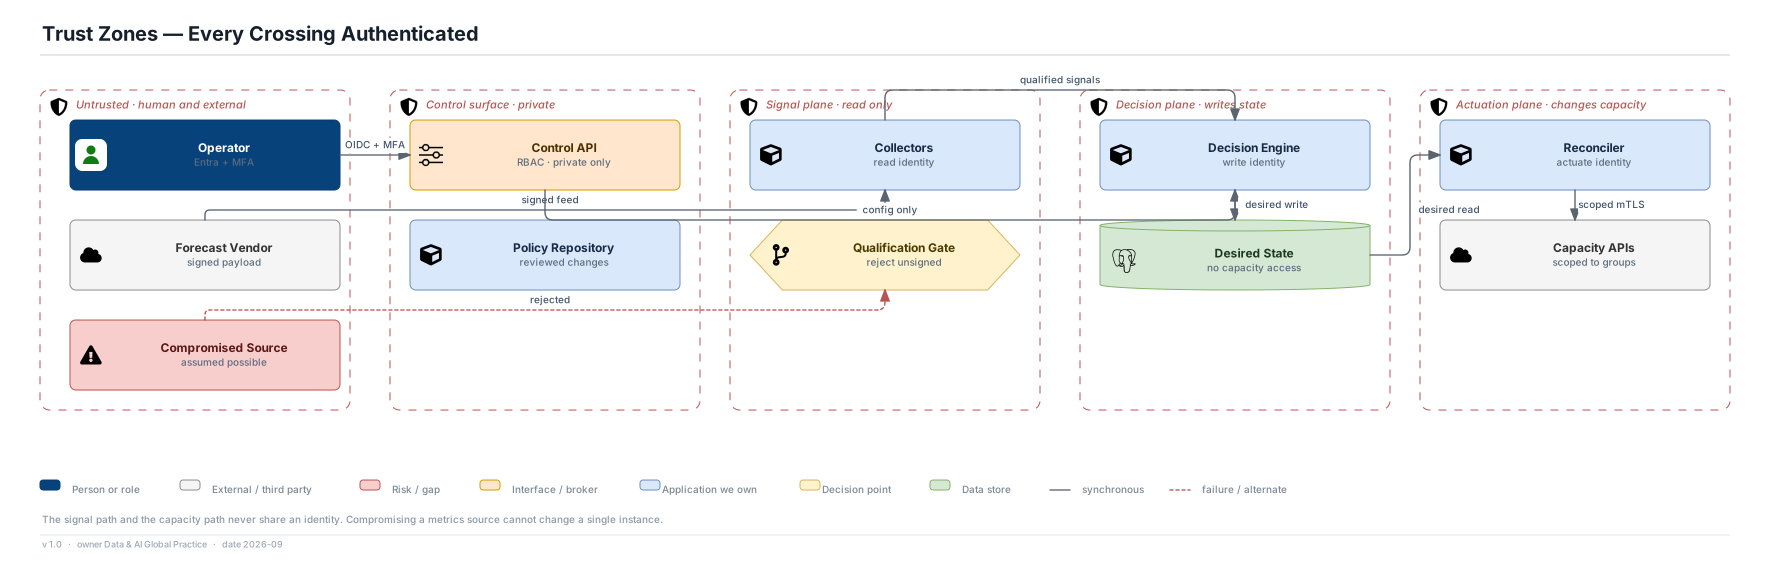
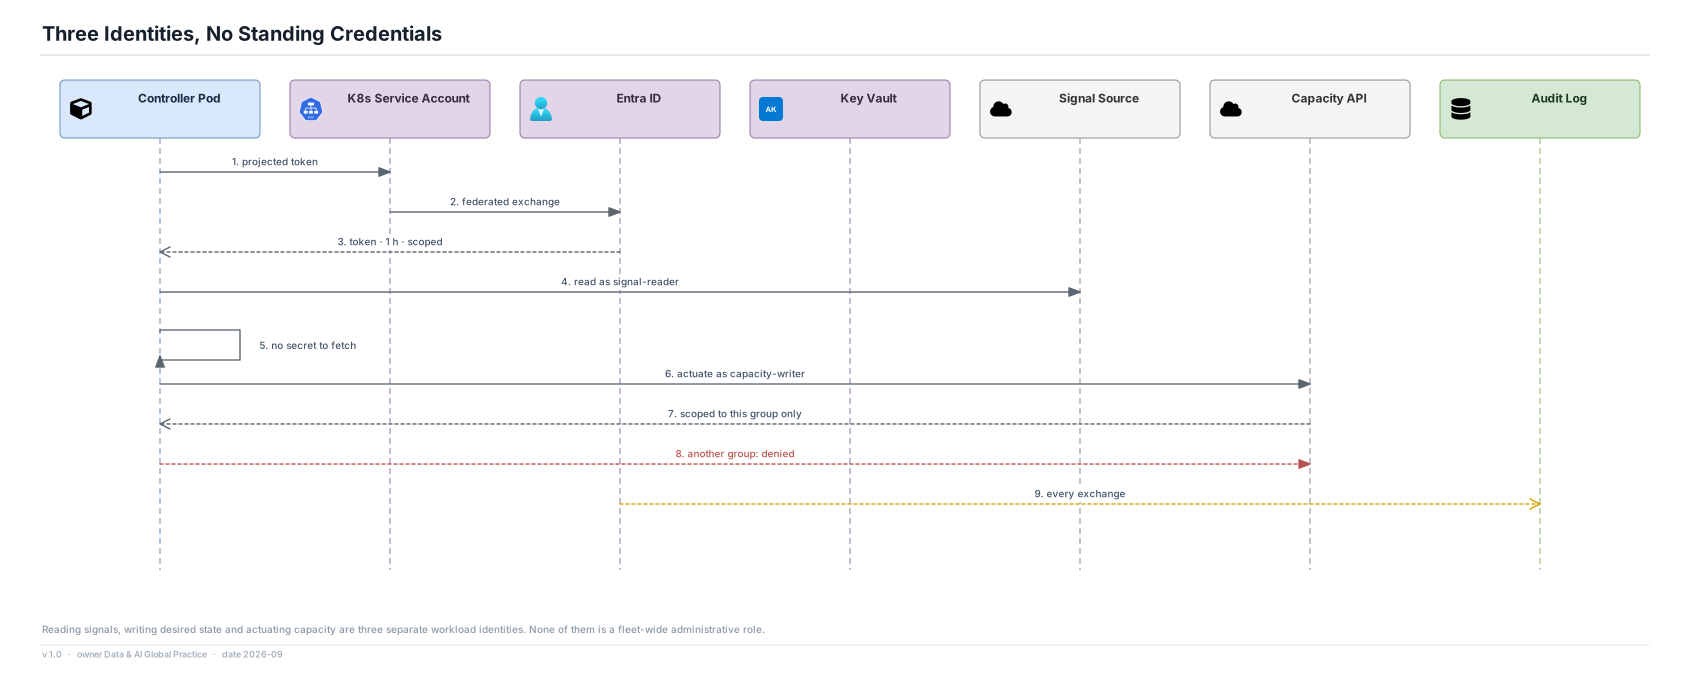
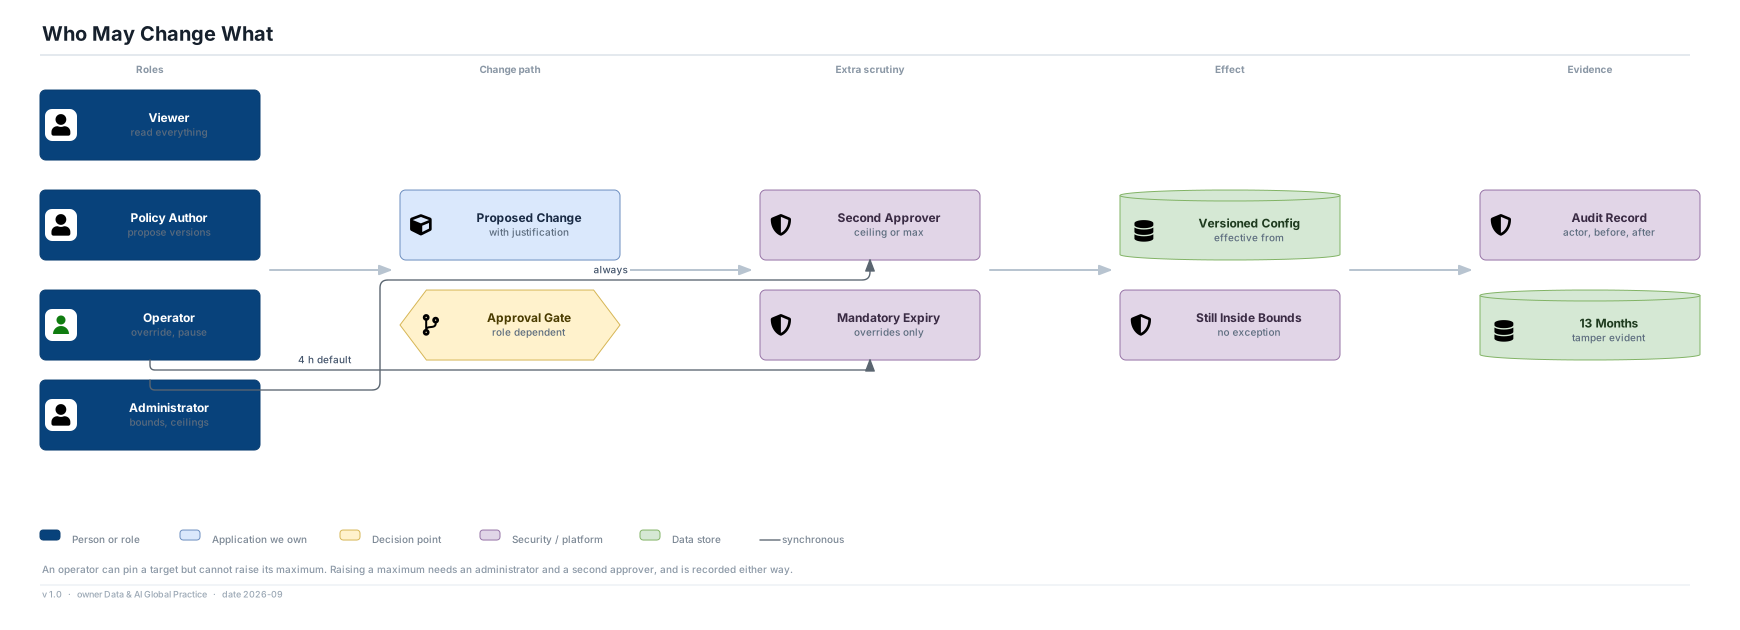
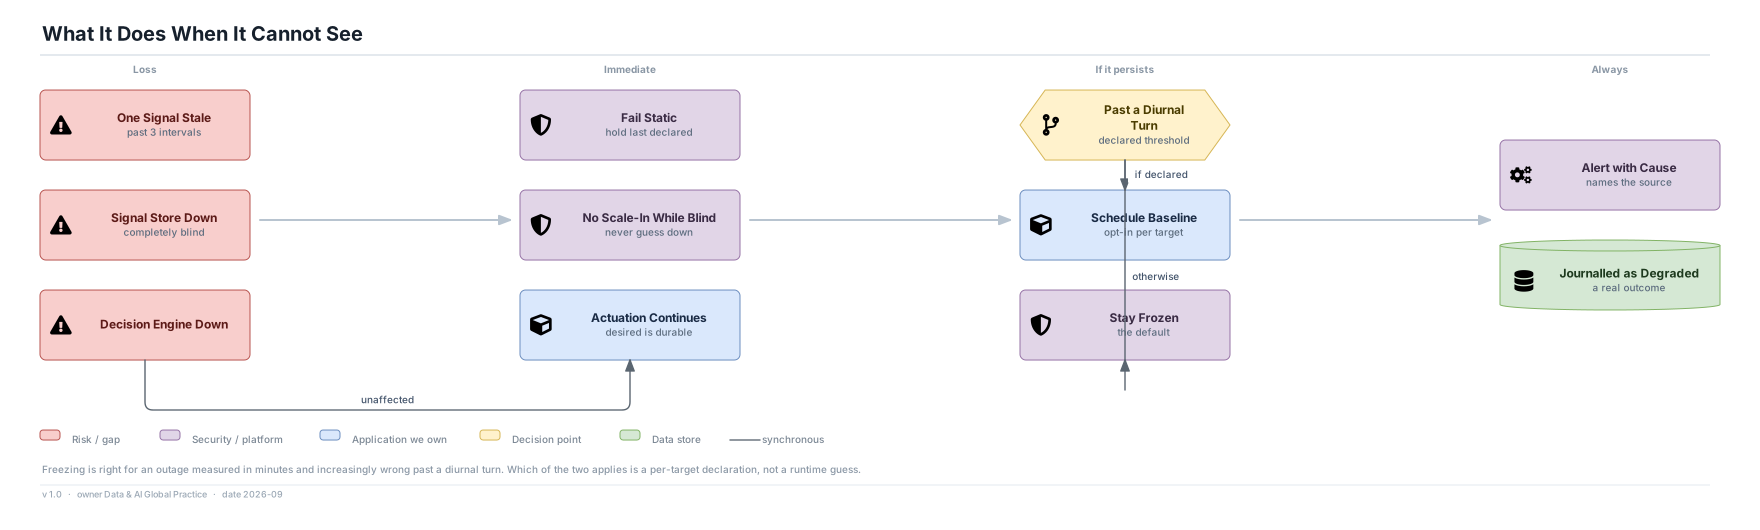
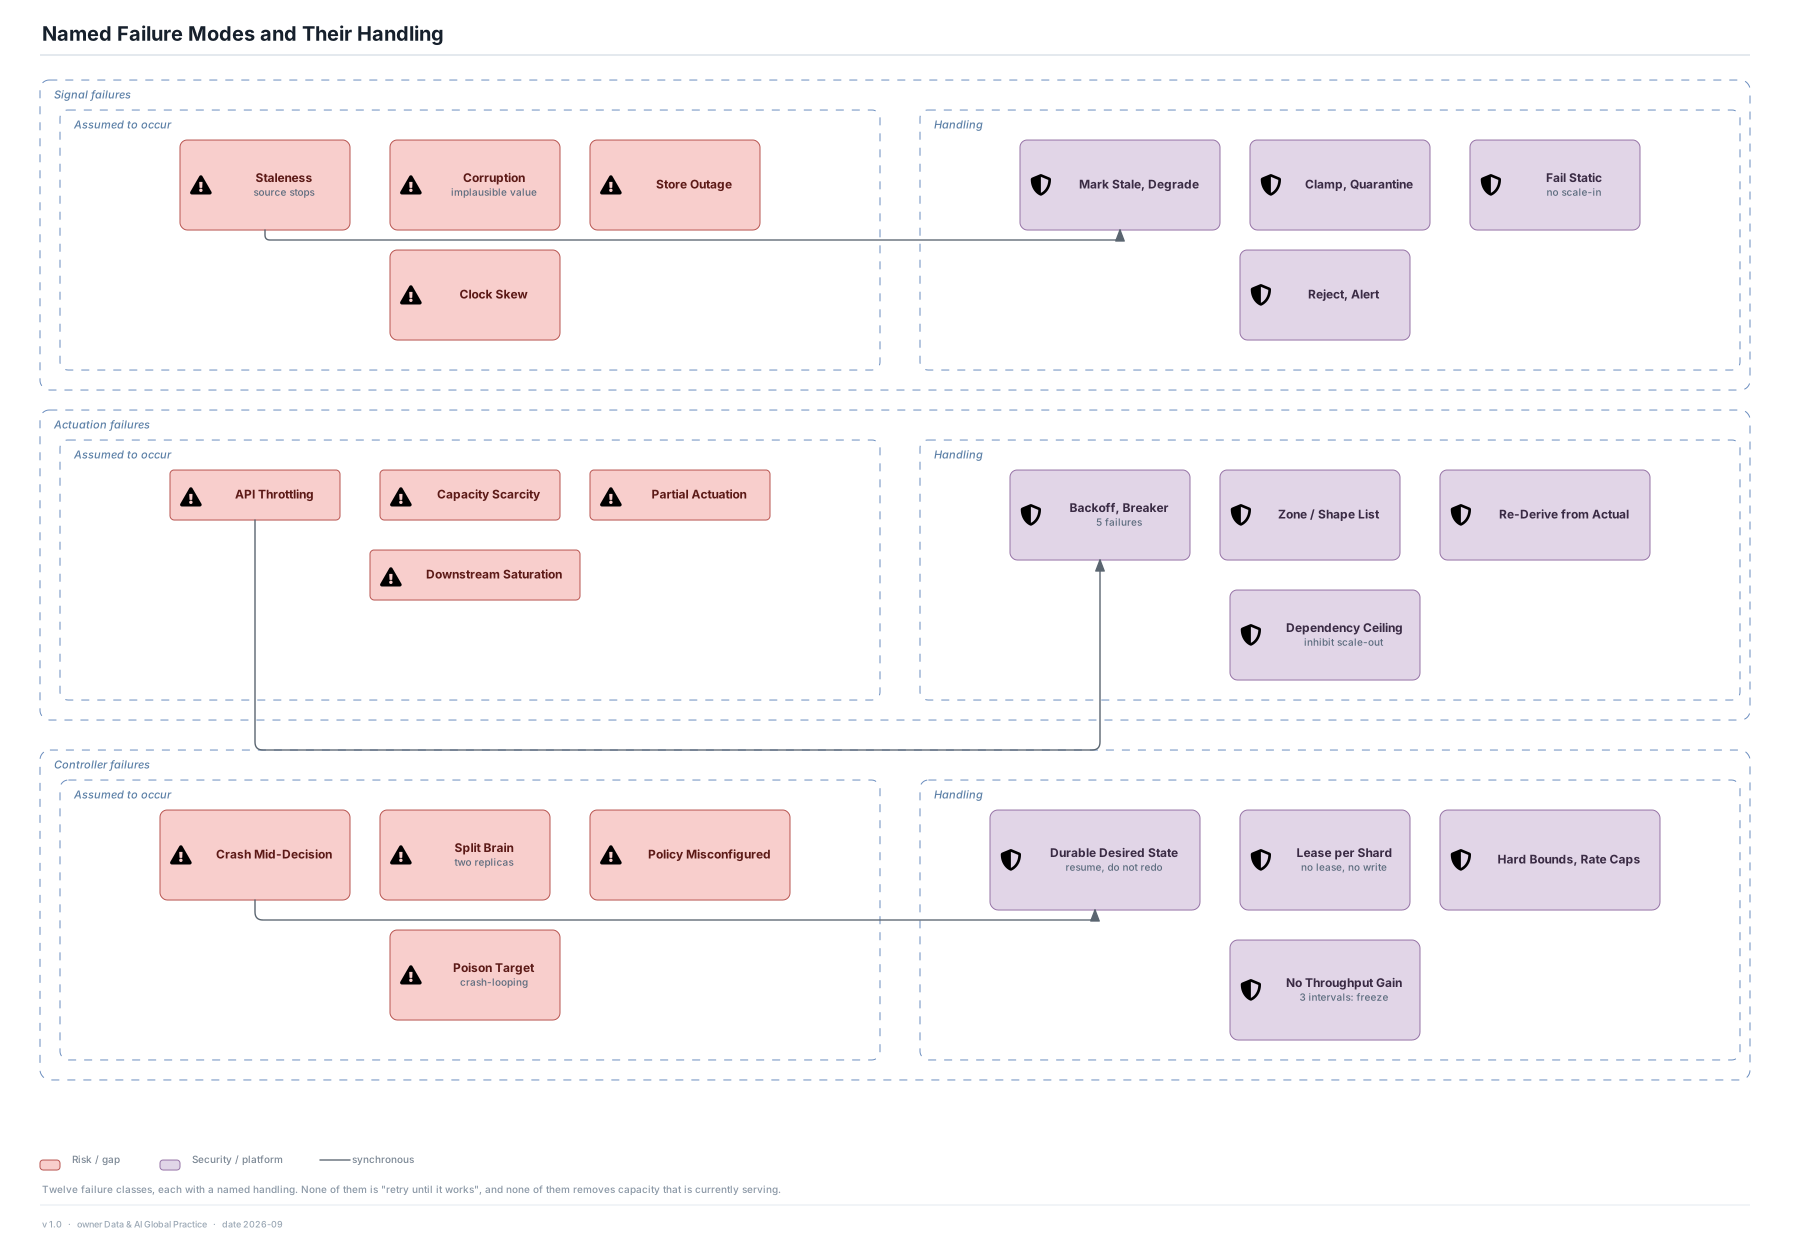
A closed-loop controller that observes demand on a fleet of heterogeneous workloads and drives capacity to the smallest number that still meets the service objective. Read the set in order: acts 1 and 2 fix the boundary and the plane separation everything else follows from; act 3 says which store is the truth and which is rebuildable; act 4 shows what actually happens in one 15 second interval, on the way up and on the way down; act 5 covers running it and paying for it; act 6 covers why it is safe and what it does when it is wrong or blind. One decision governs all of them — the decision plane writes a number, the actuation plane converges on it, and they are joined only by a durable record.
1 · Context and scope
The boundary, who feeds it and what it drives, and the loop that is the whole system.
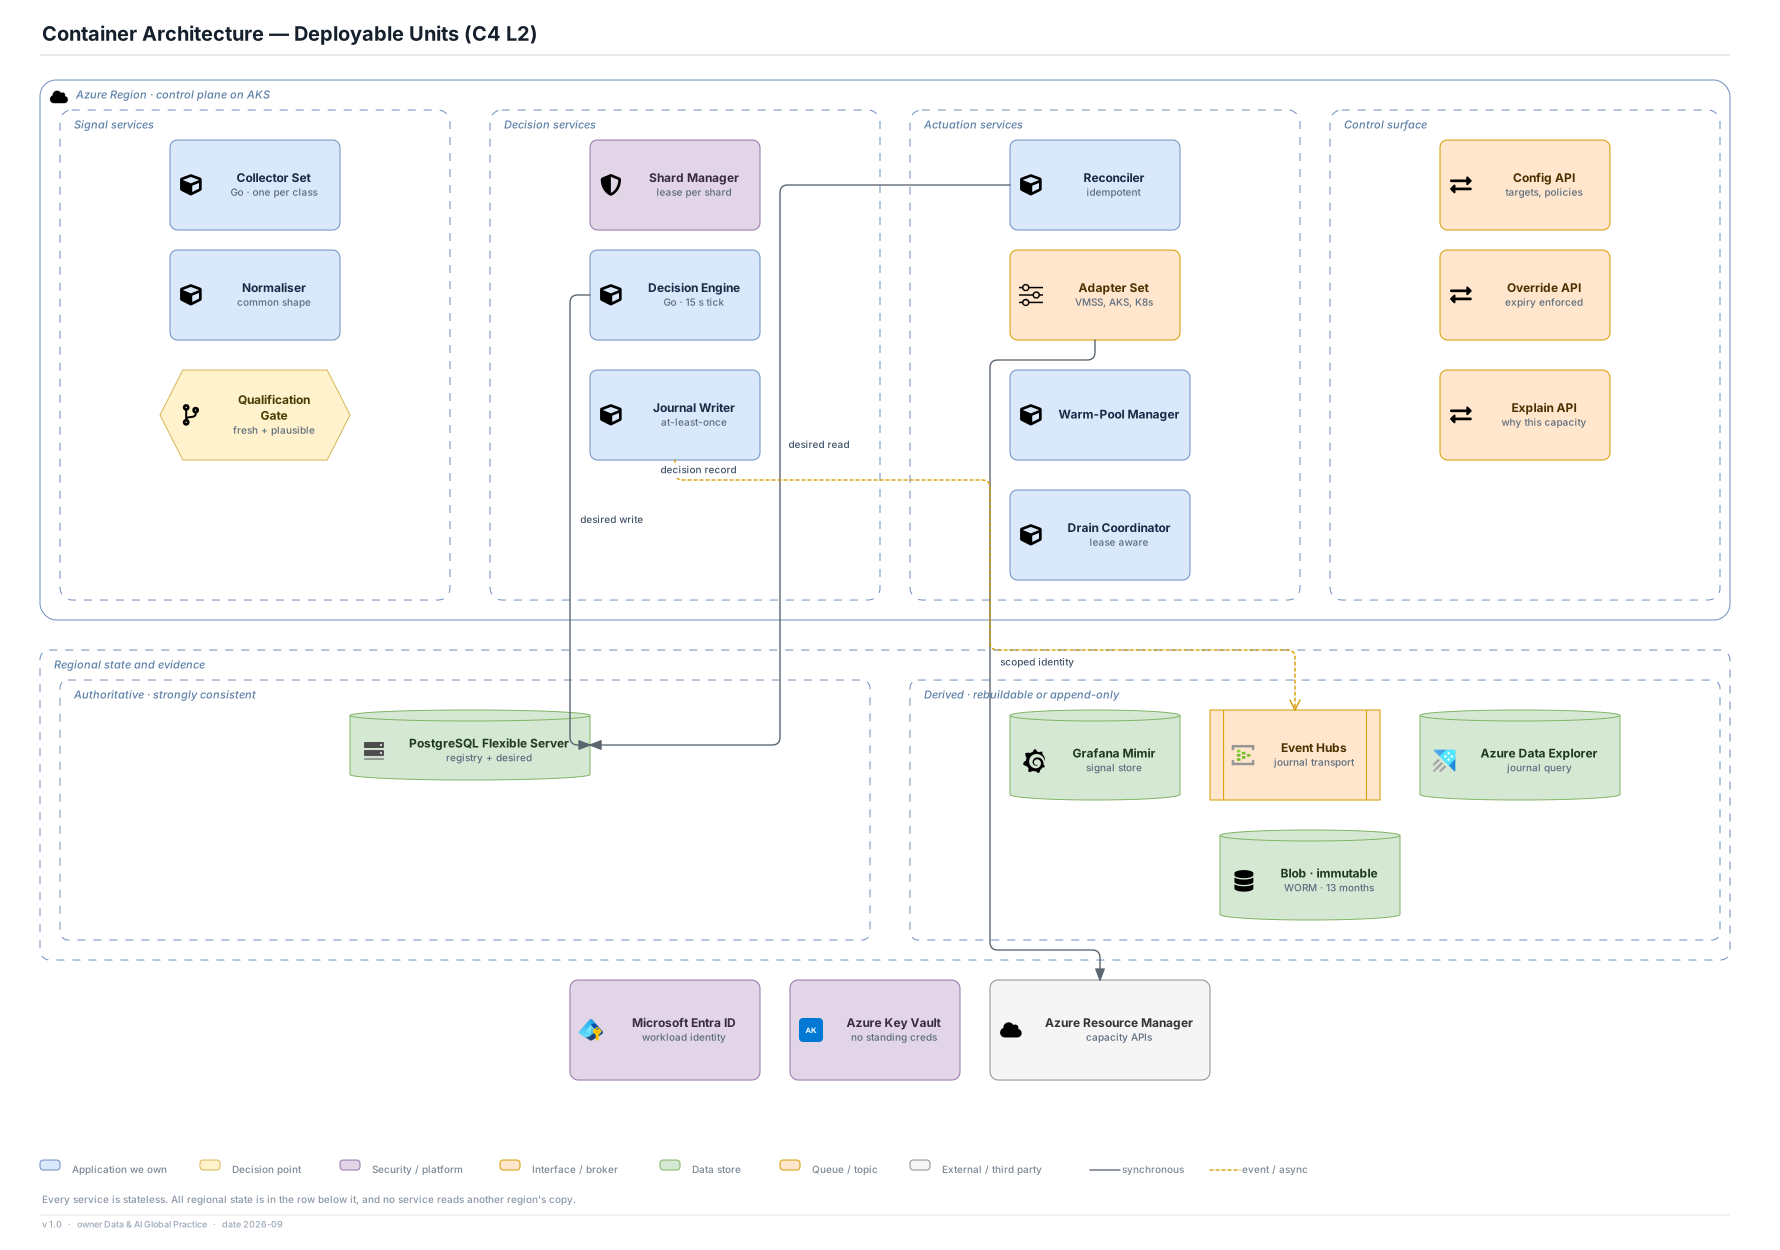
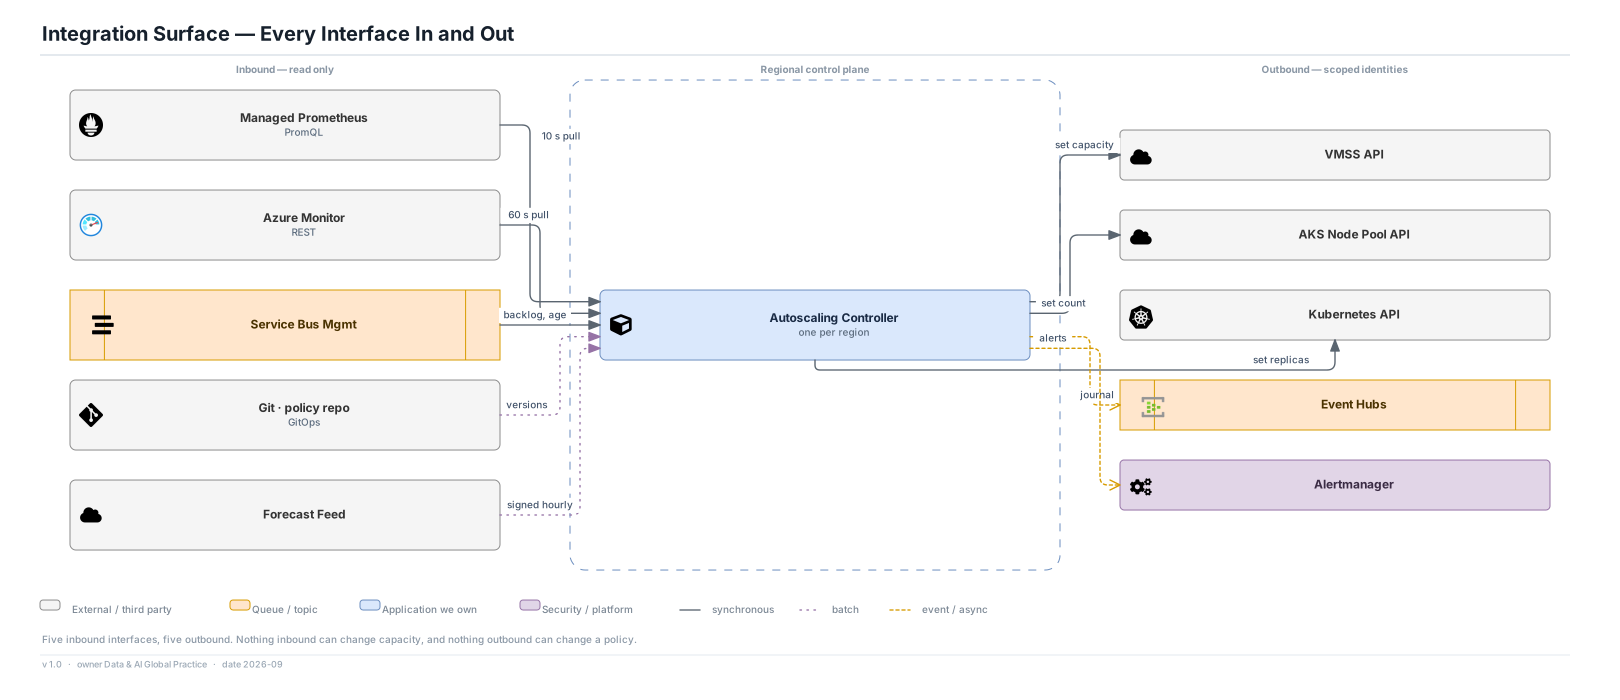
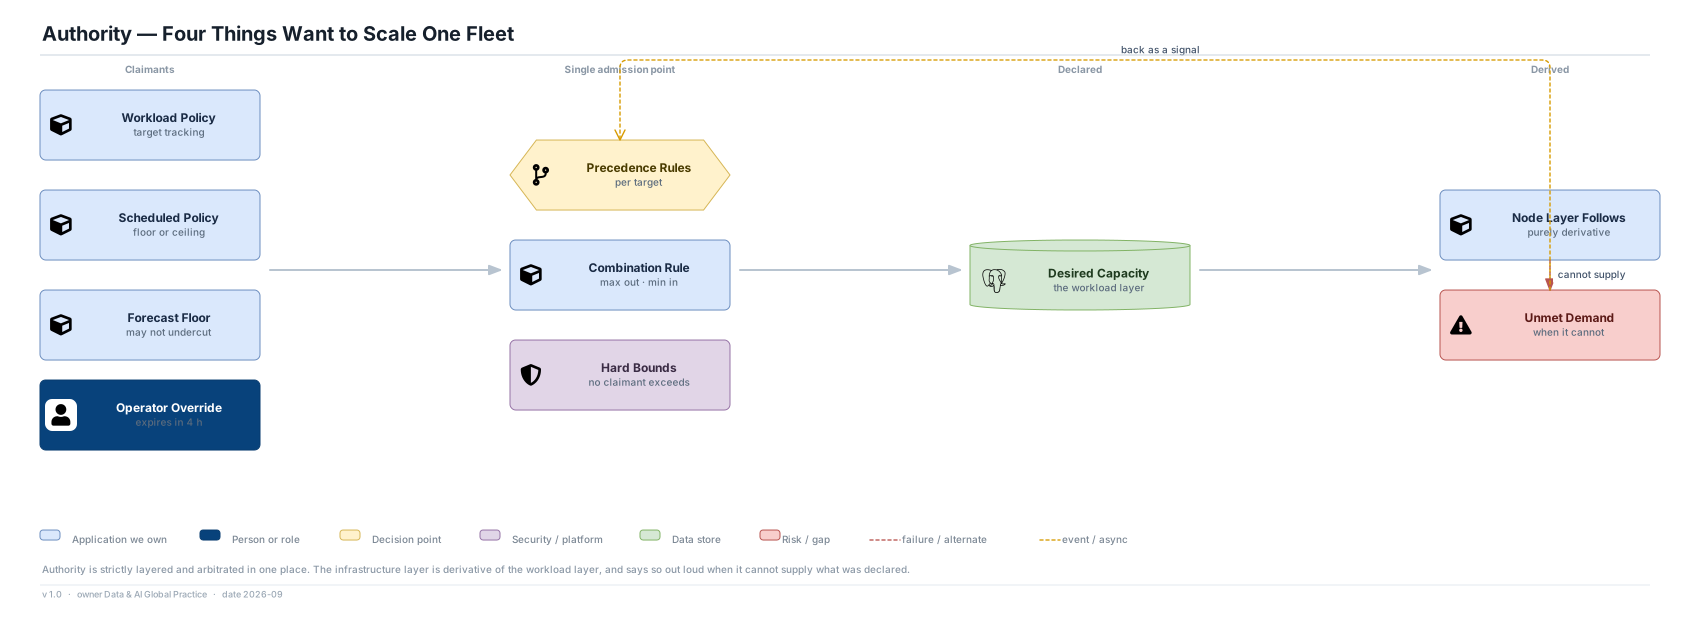
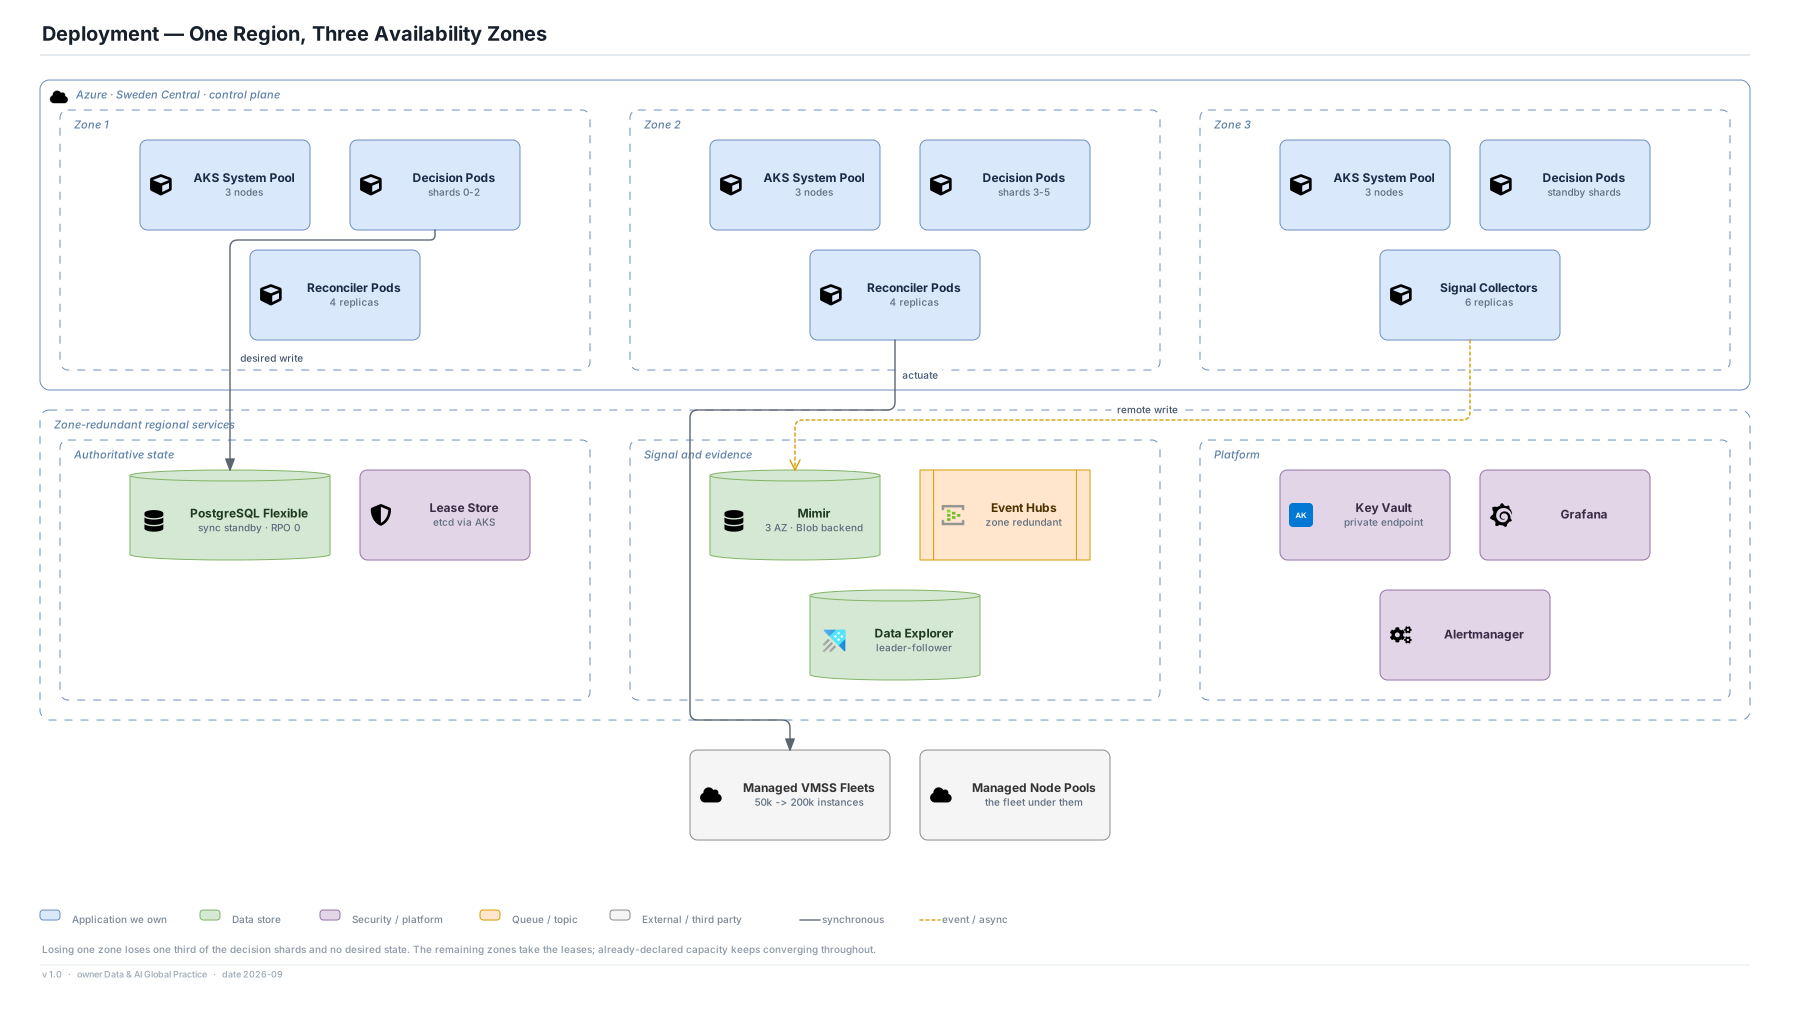
The plane separation that makes it safe, the deployable units inside each plane, every interface, and who wins when four things want to scale one fleet.
11Authority and ArbitrationA workload policy, a schedule, a forecast and a human can all target the same fleet. One of them wins, and it is decided in one place.HTML pageSVGdraw.io
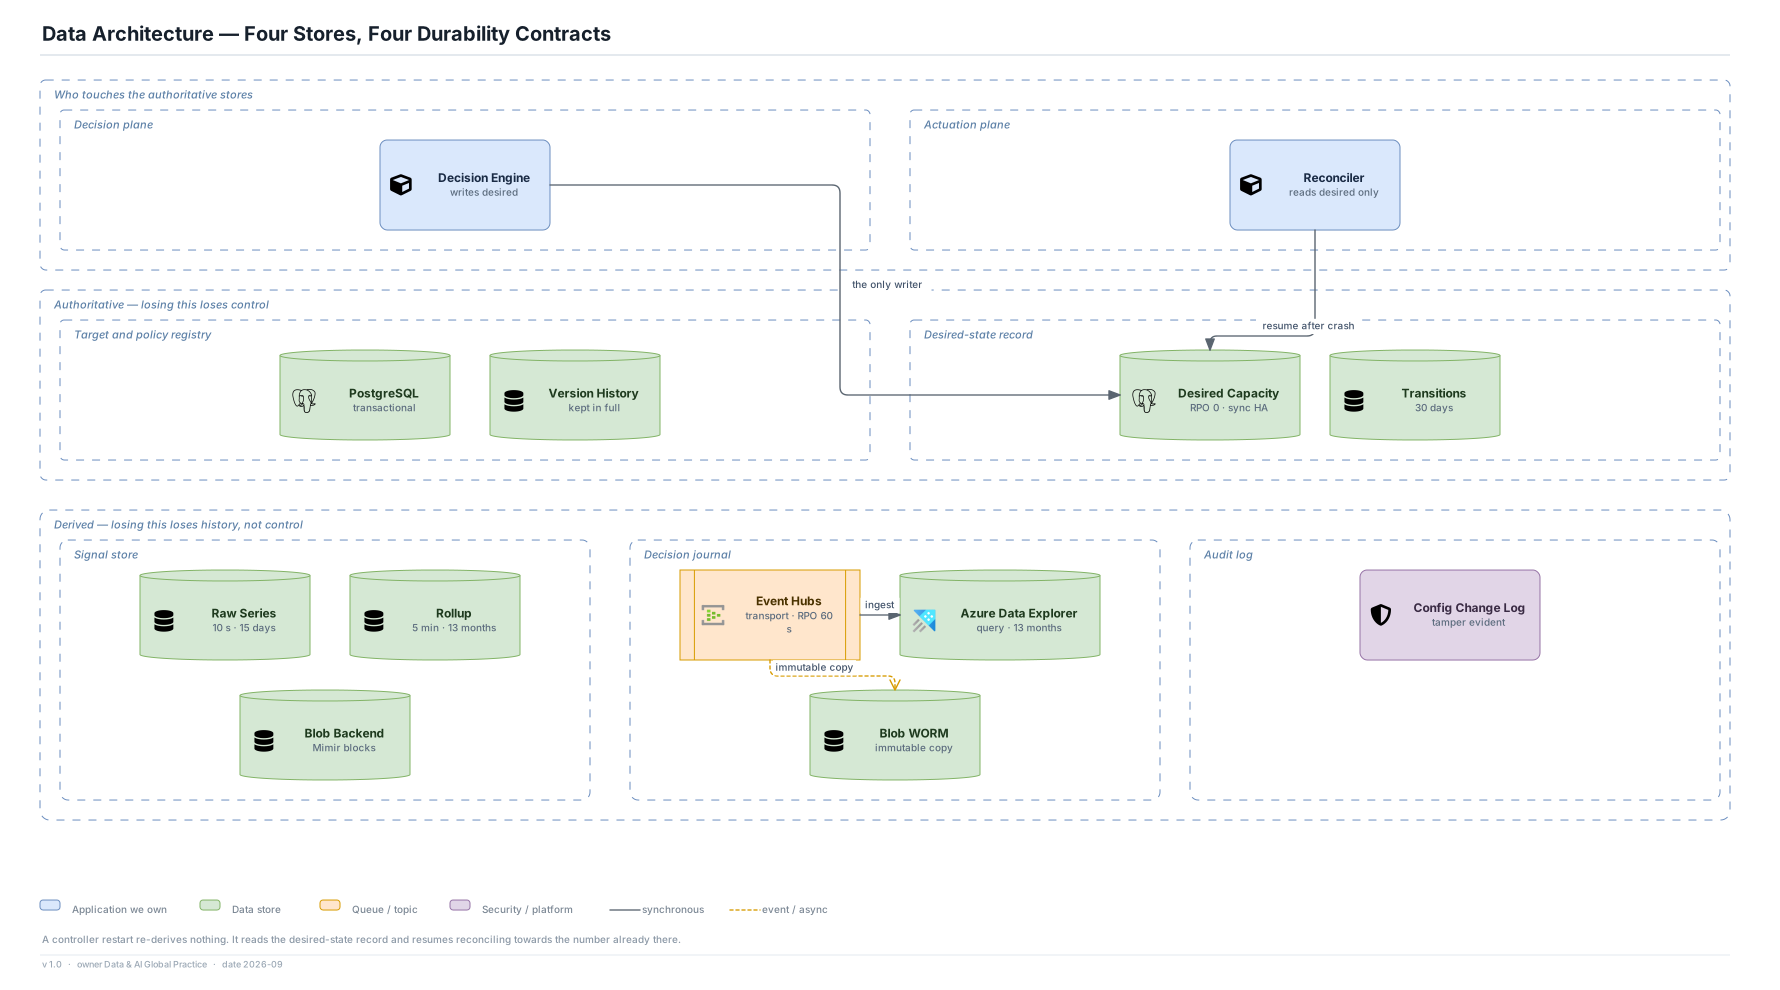
3 · Data
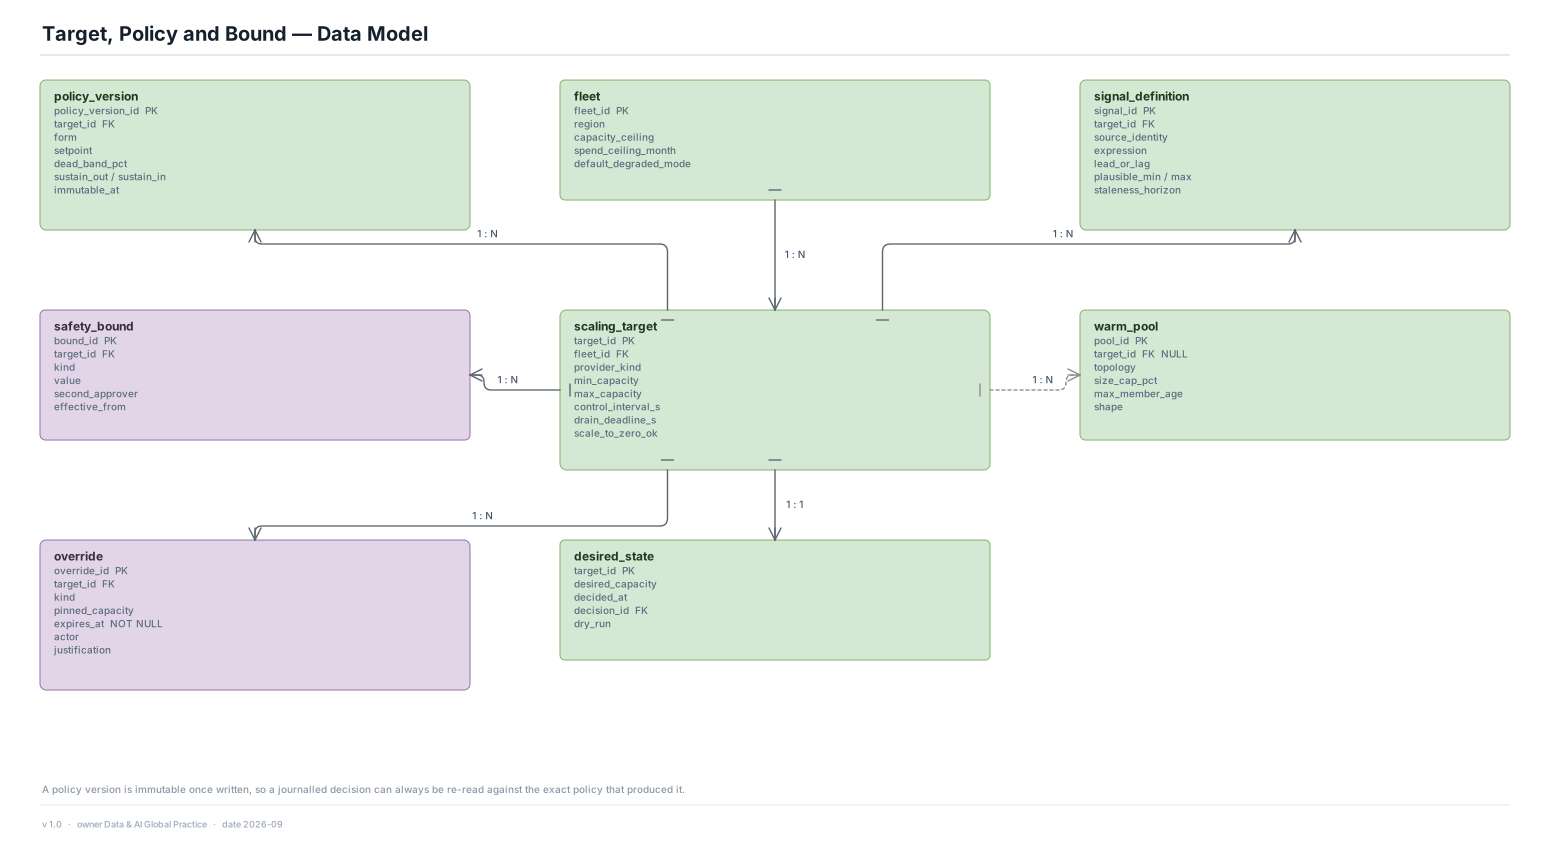
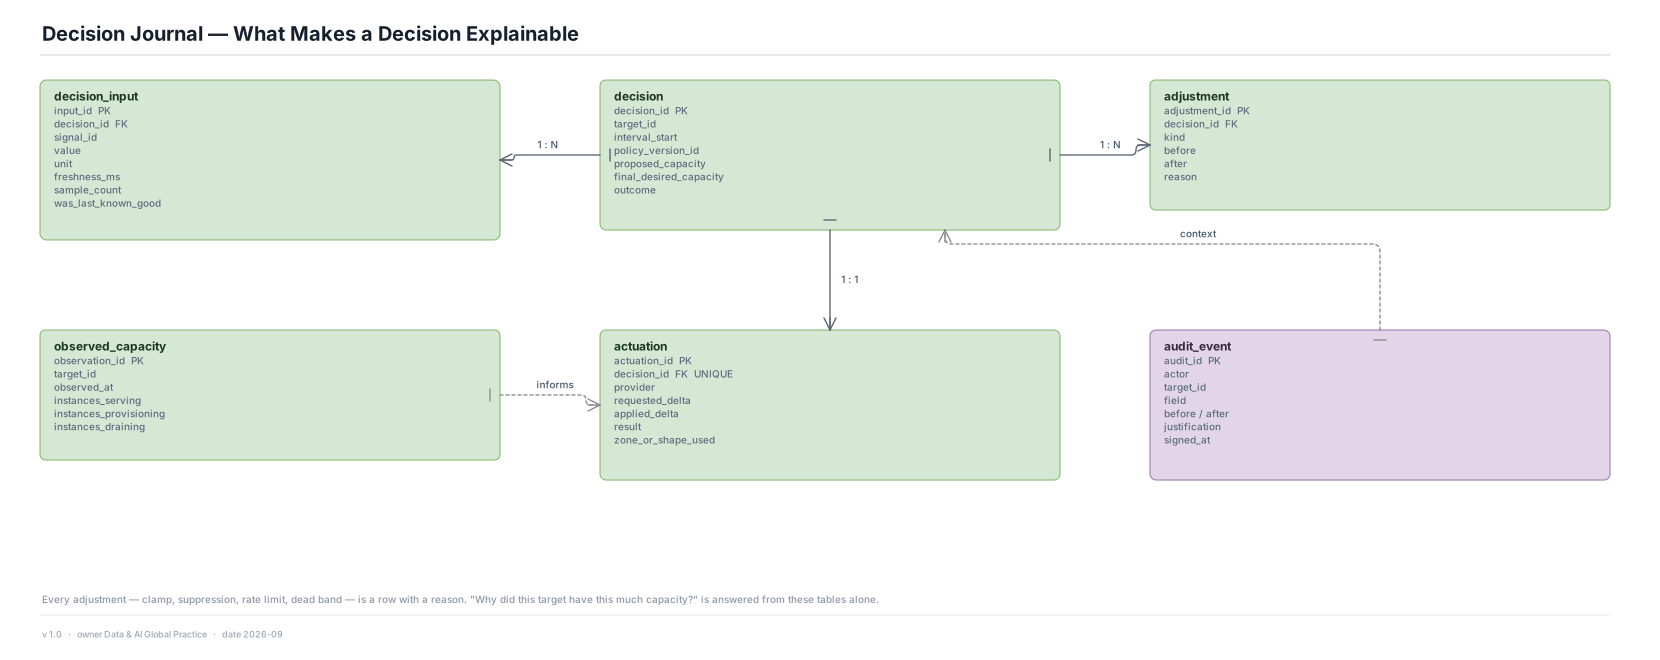
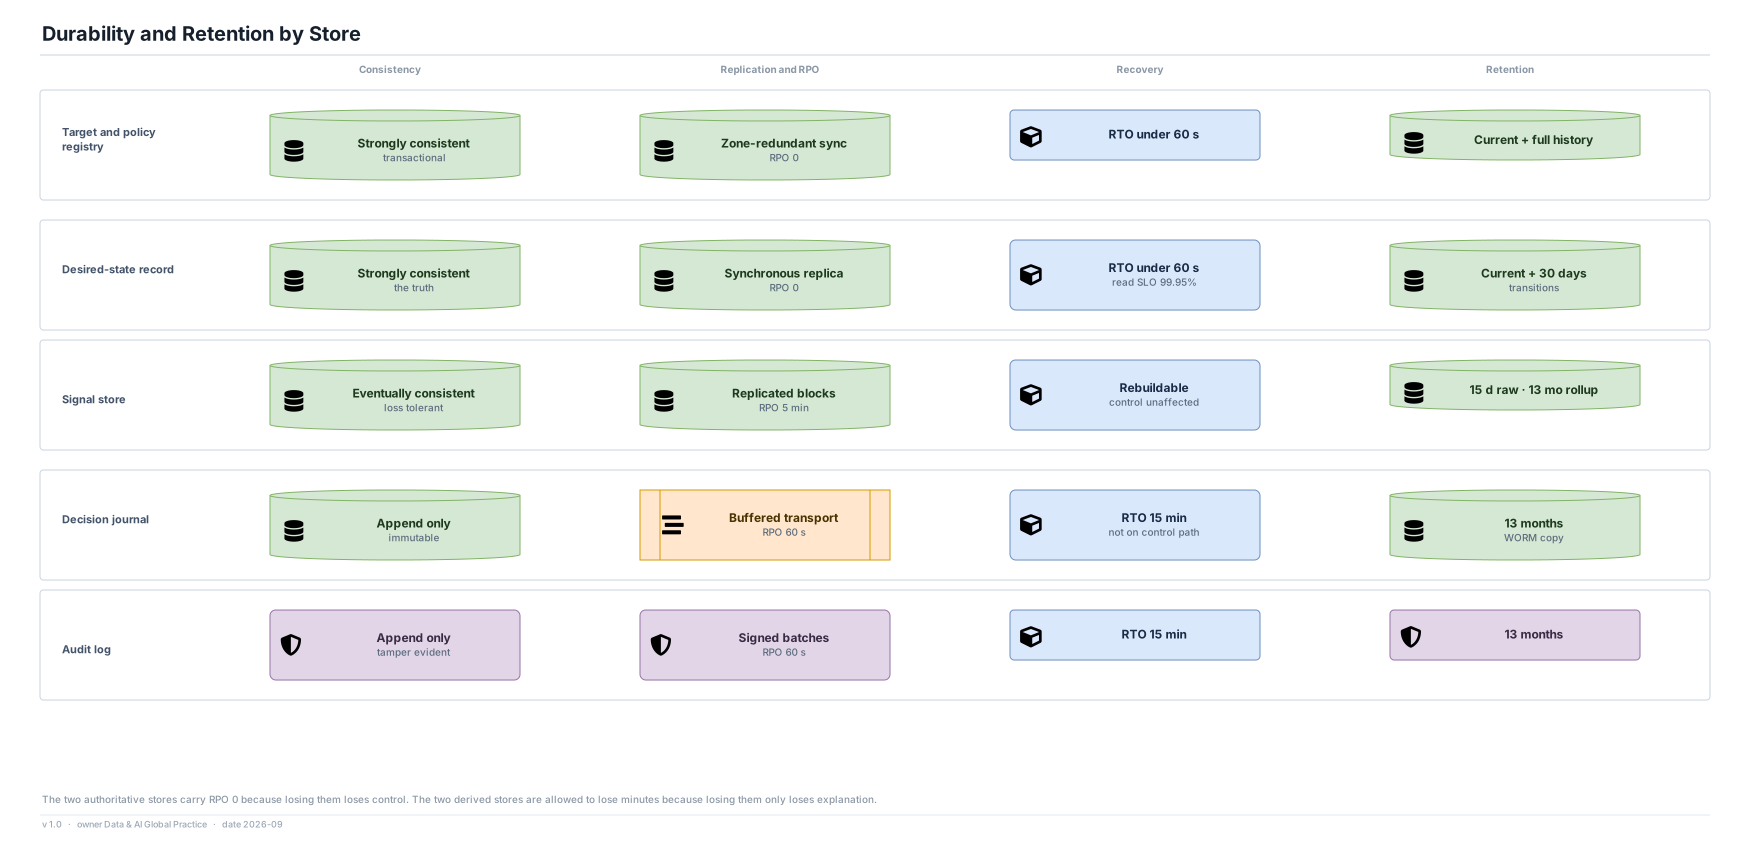
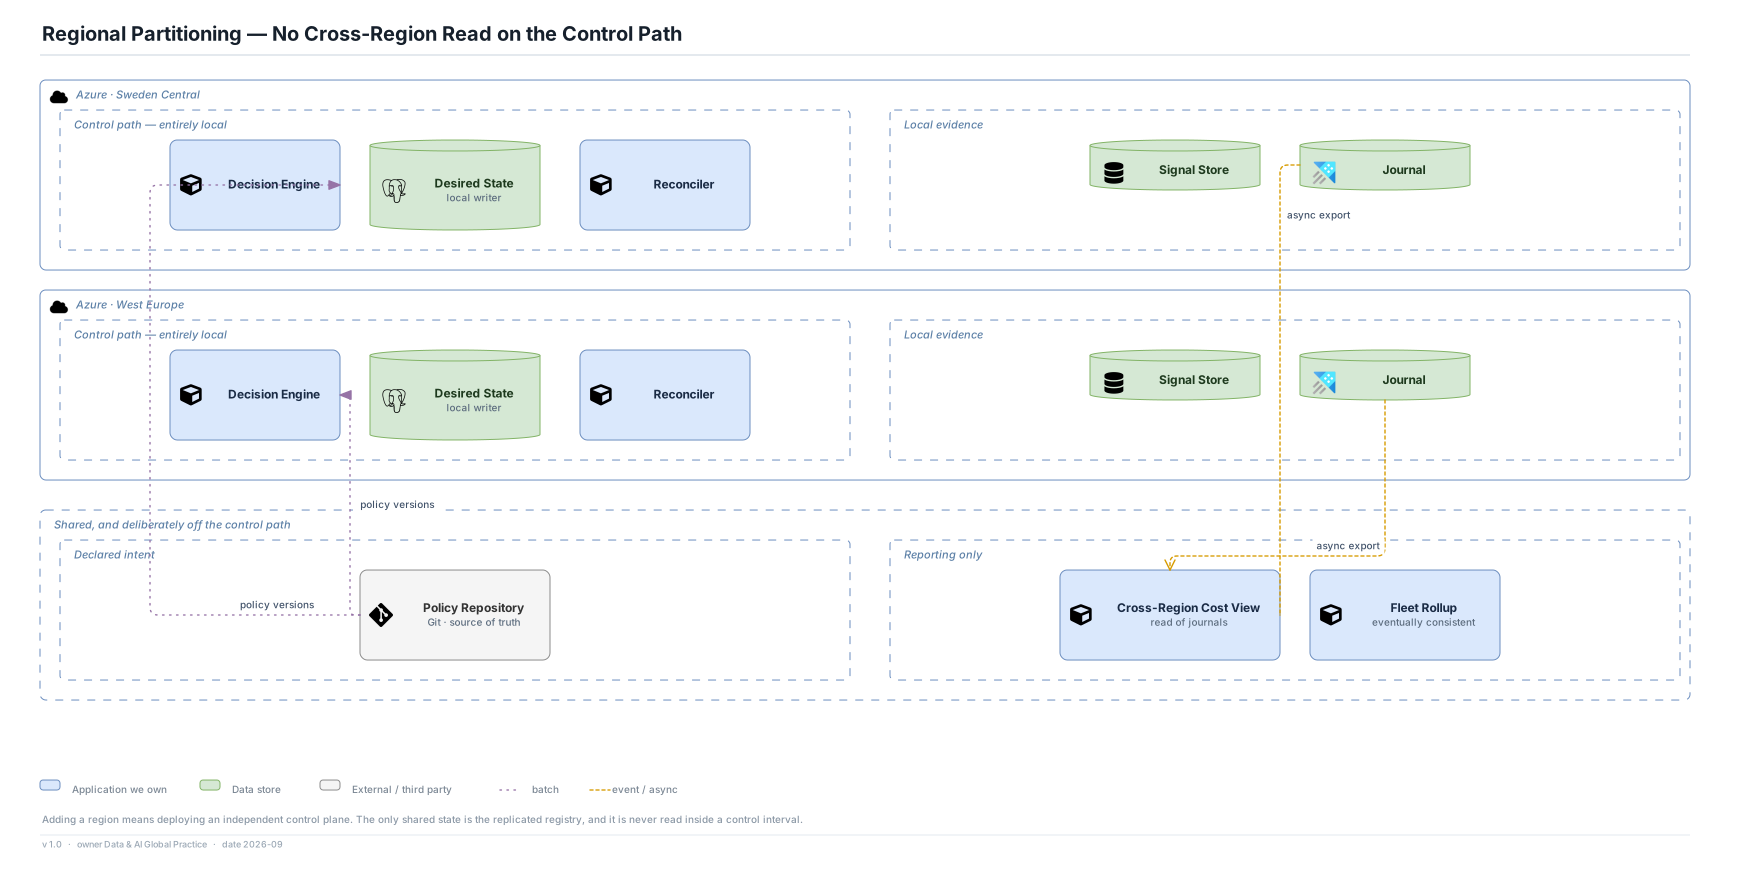
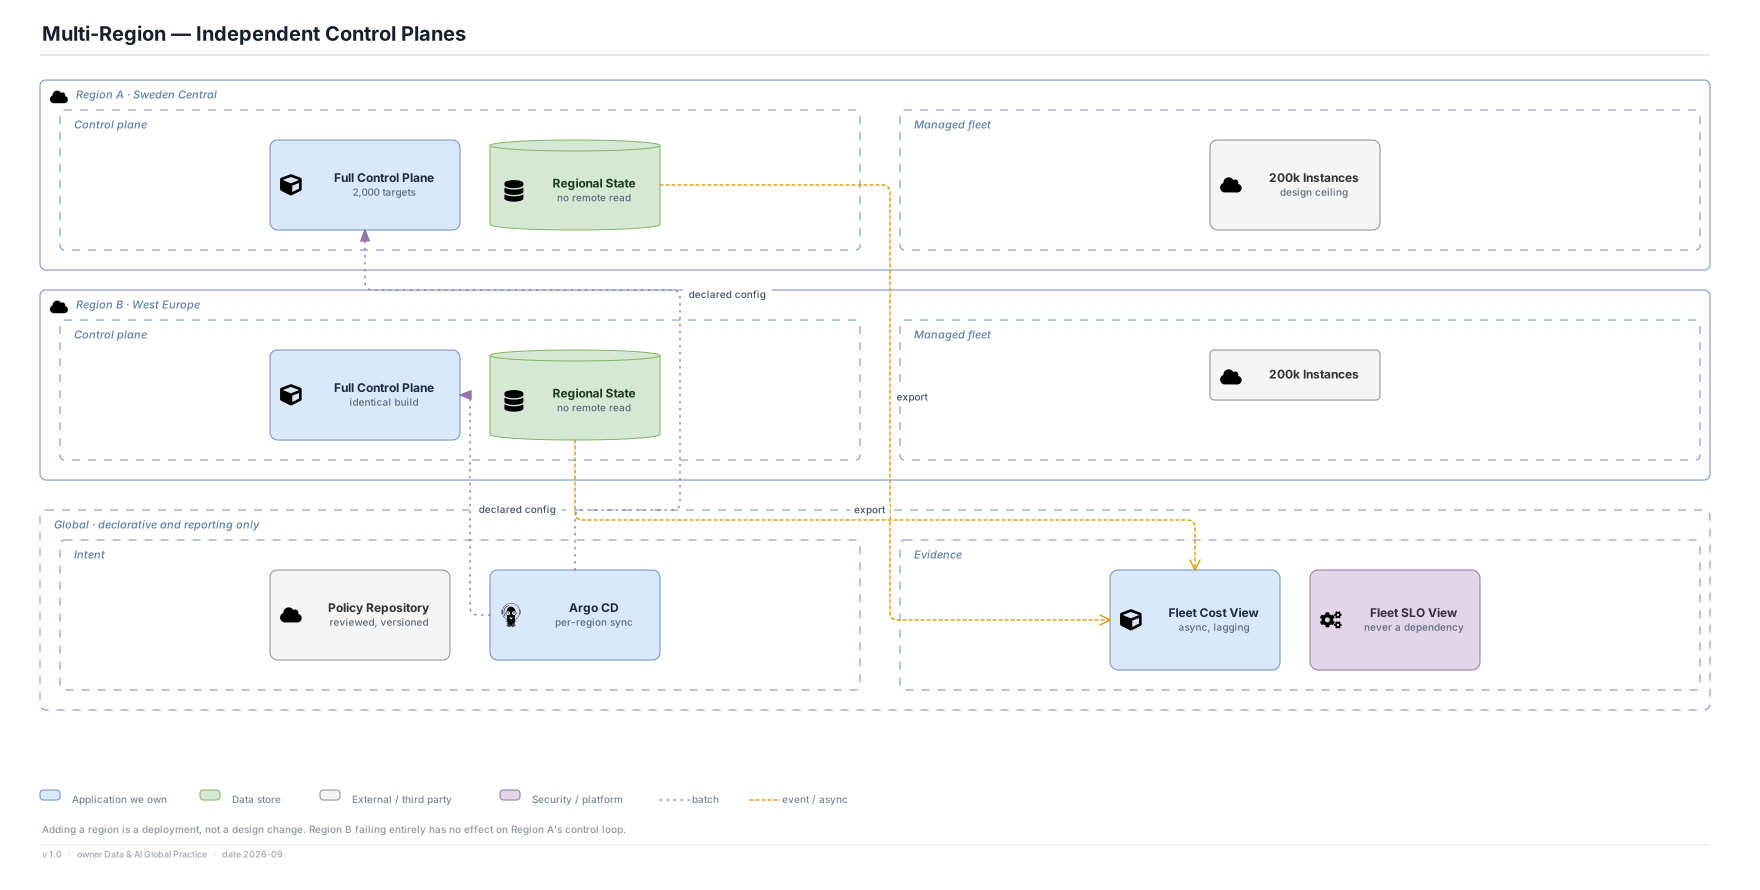
Which two stores are authoritative, which two are rebuildable, the model behind an explainable decision, and why nothing crosses a region.
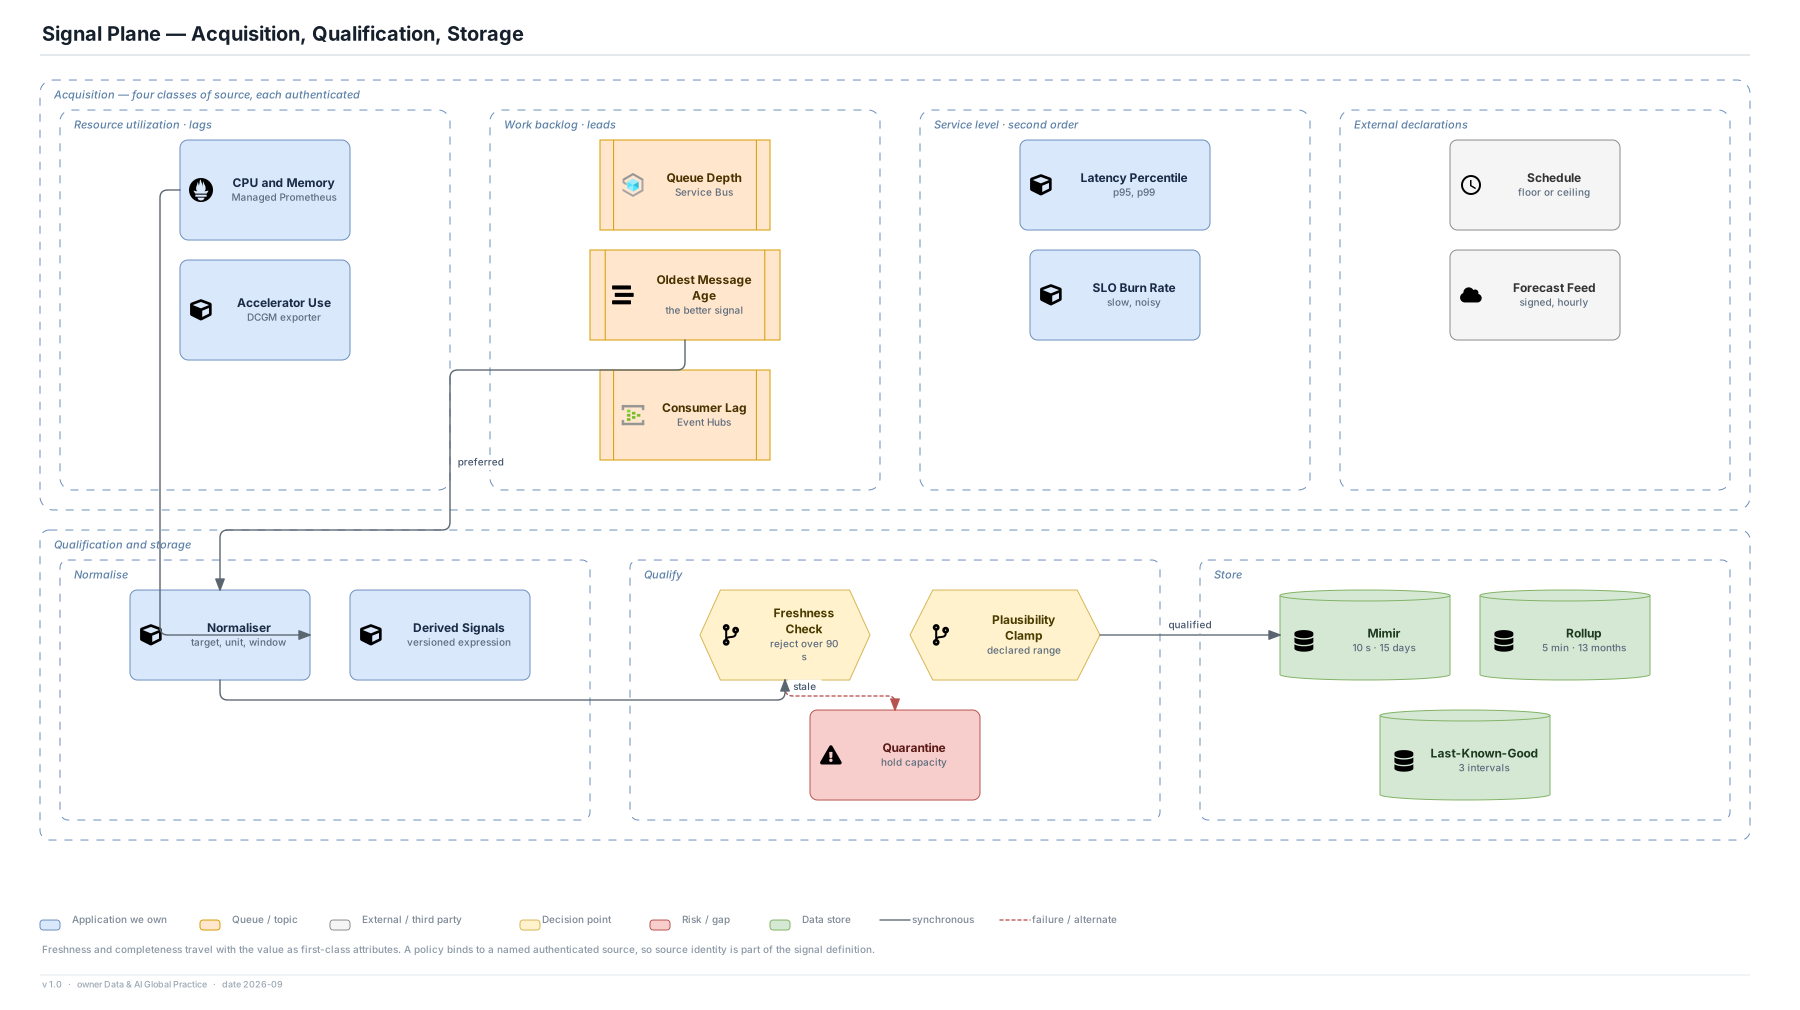
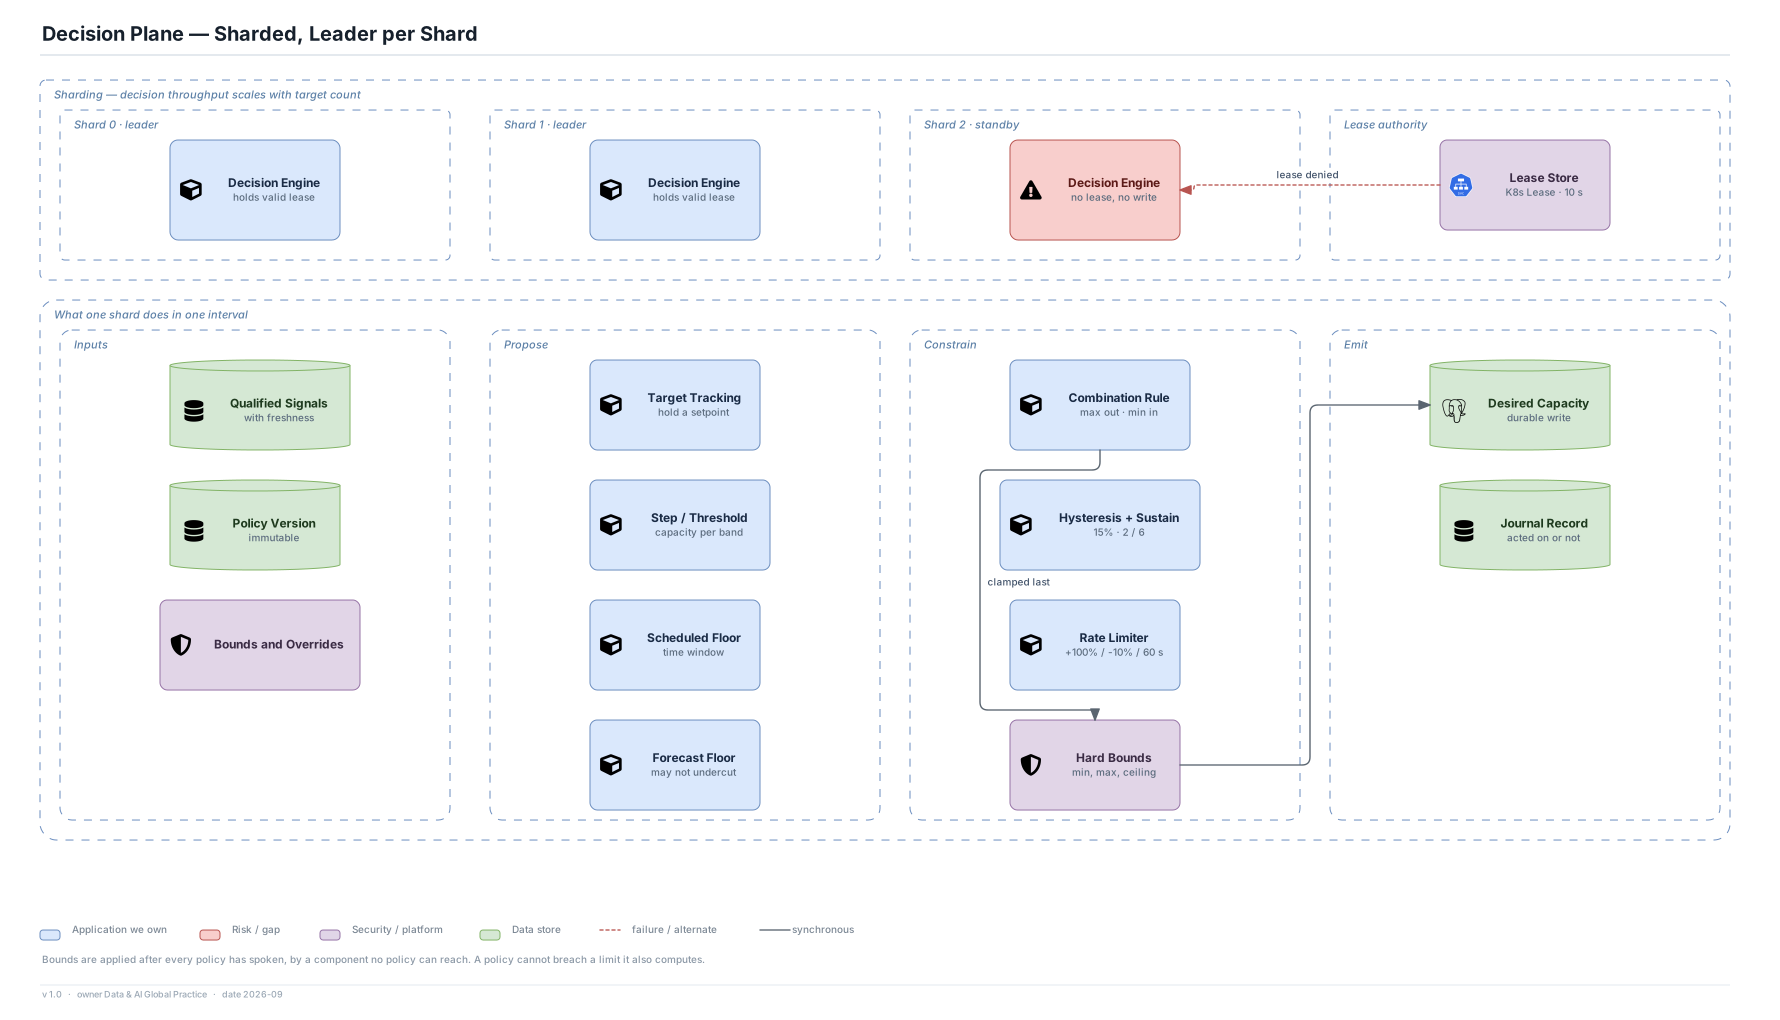
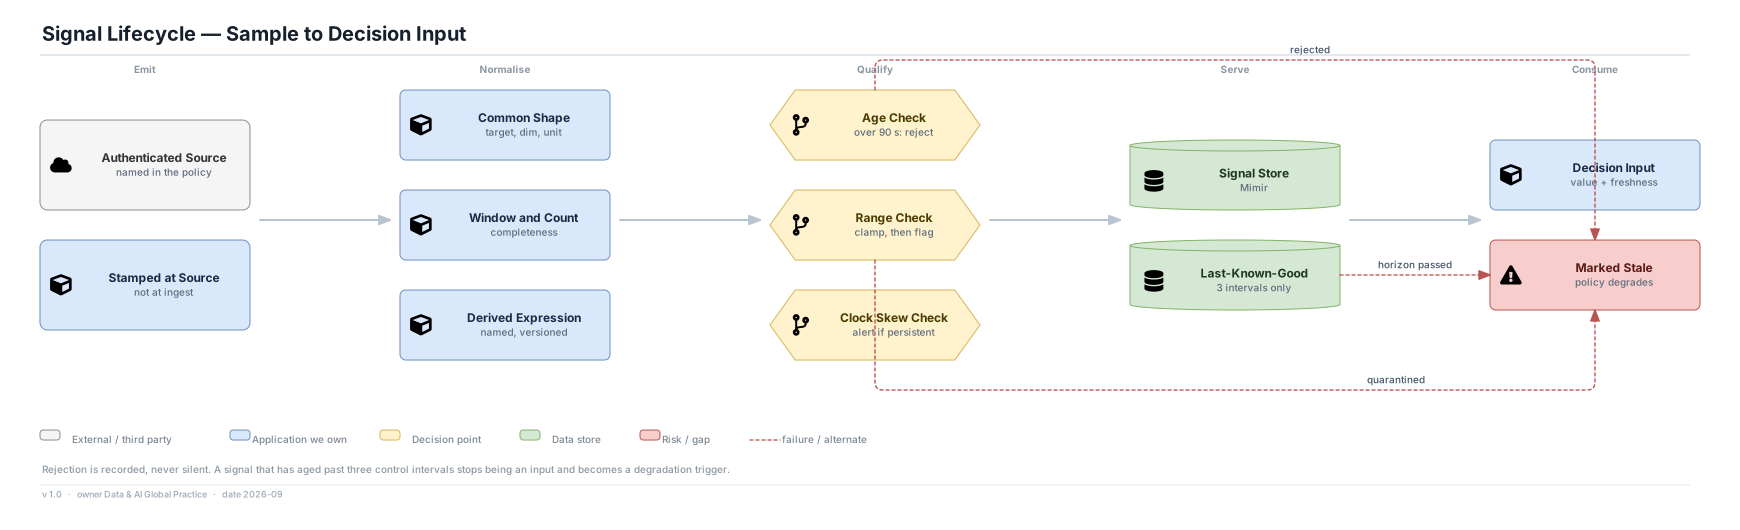
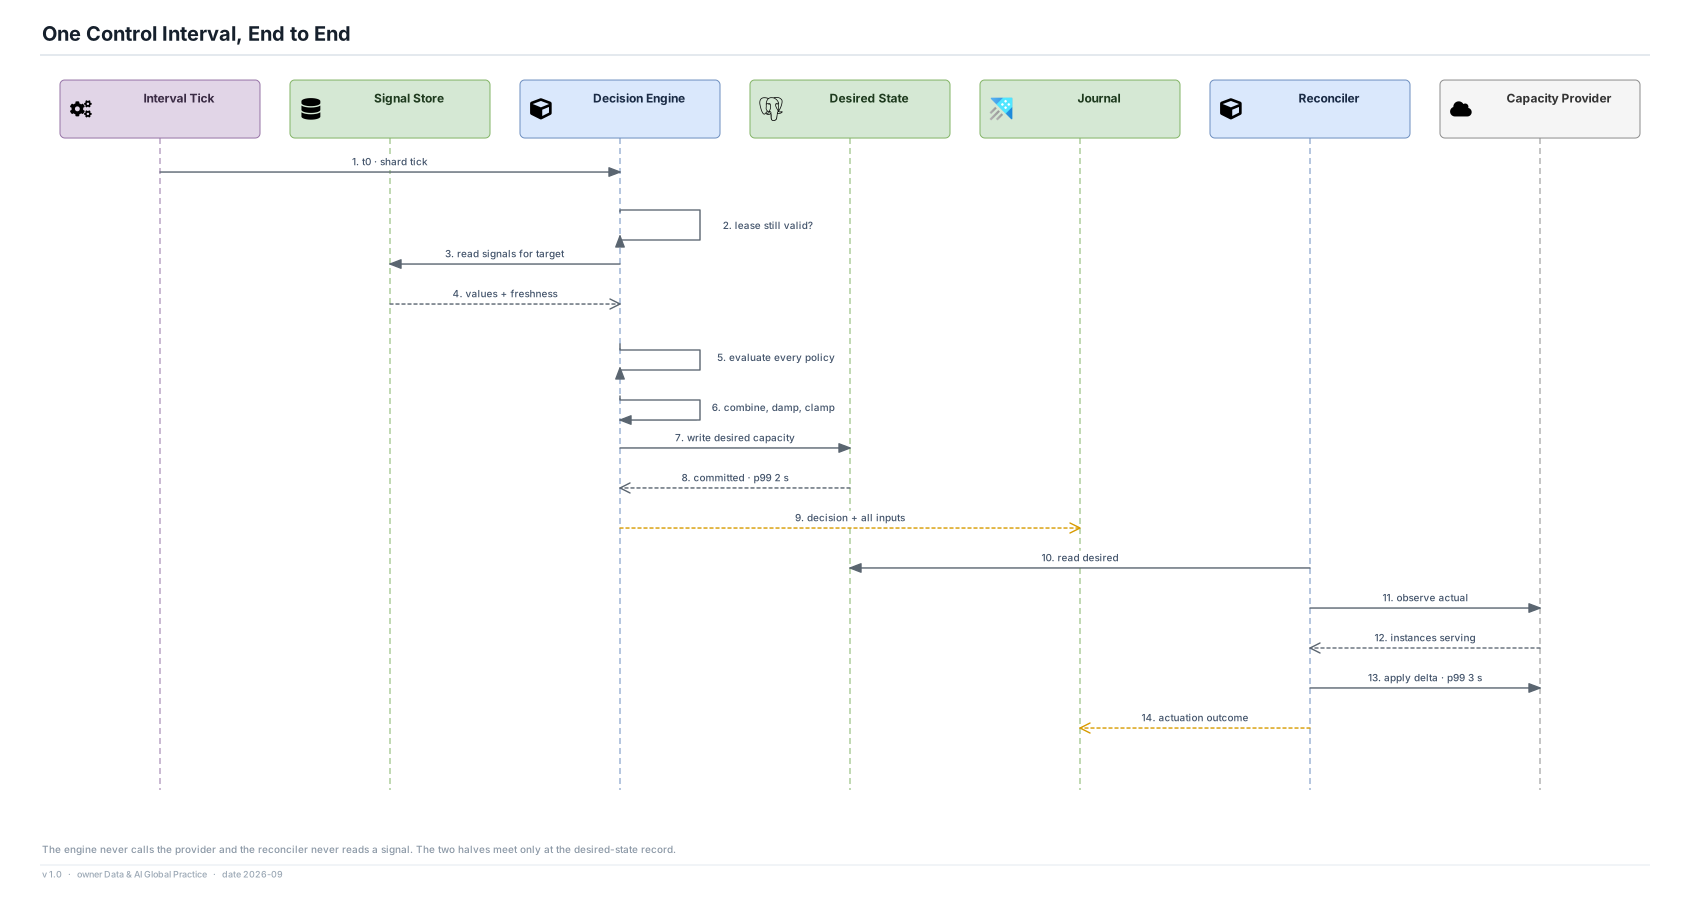
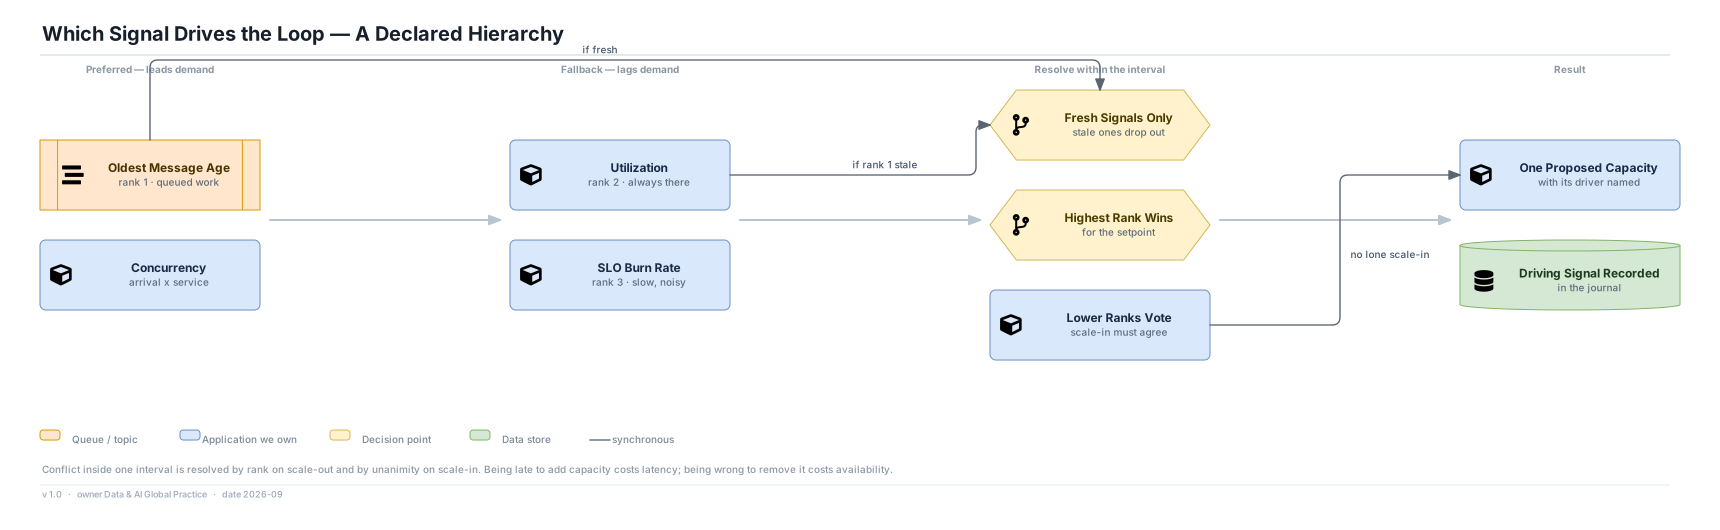
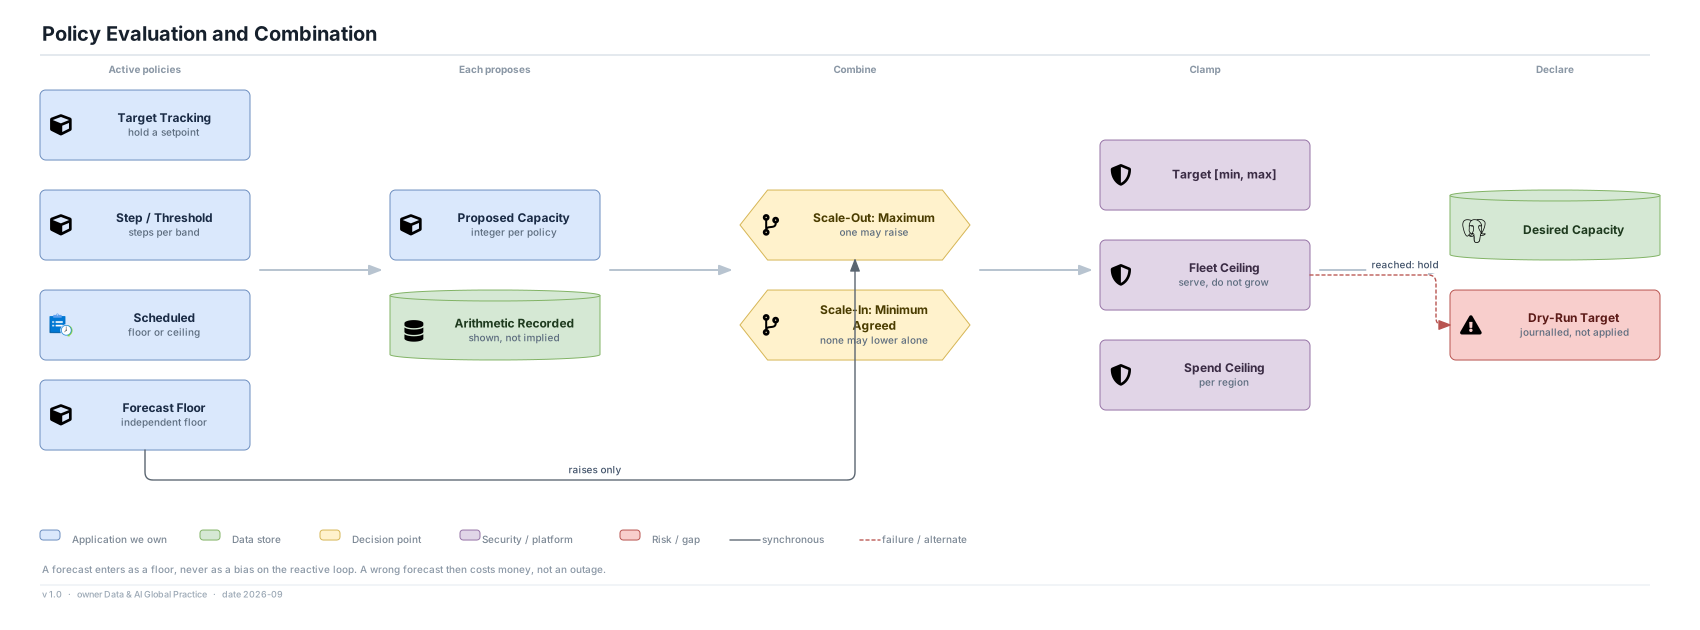
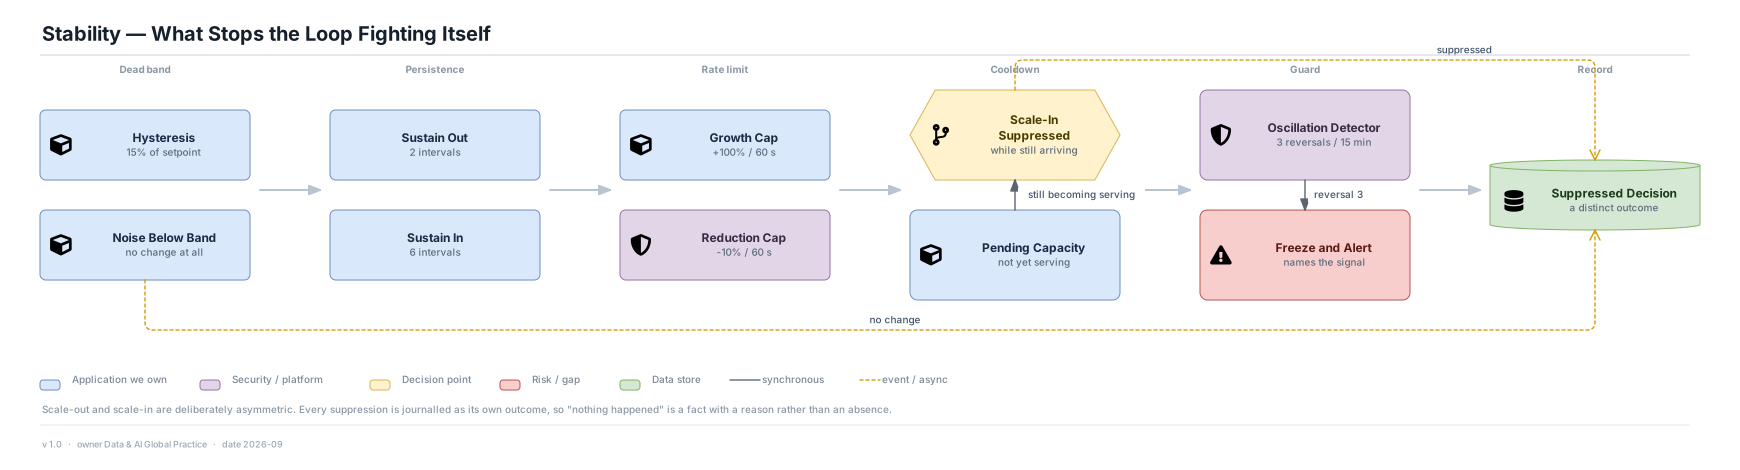
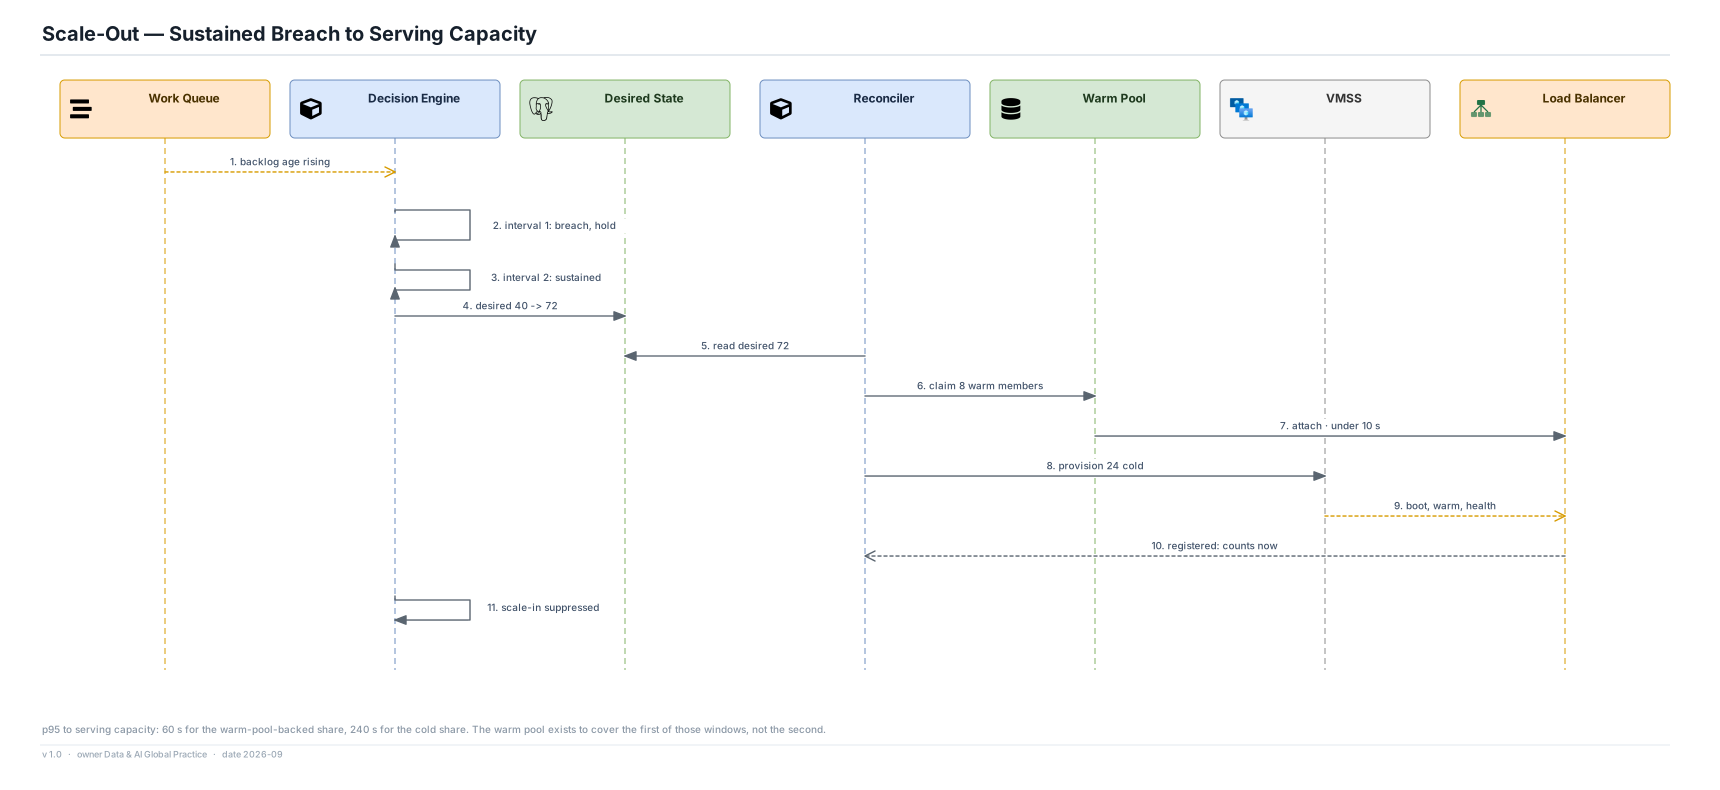
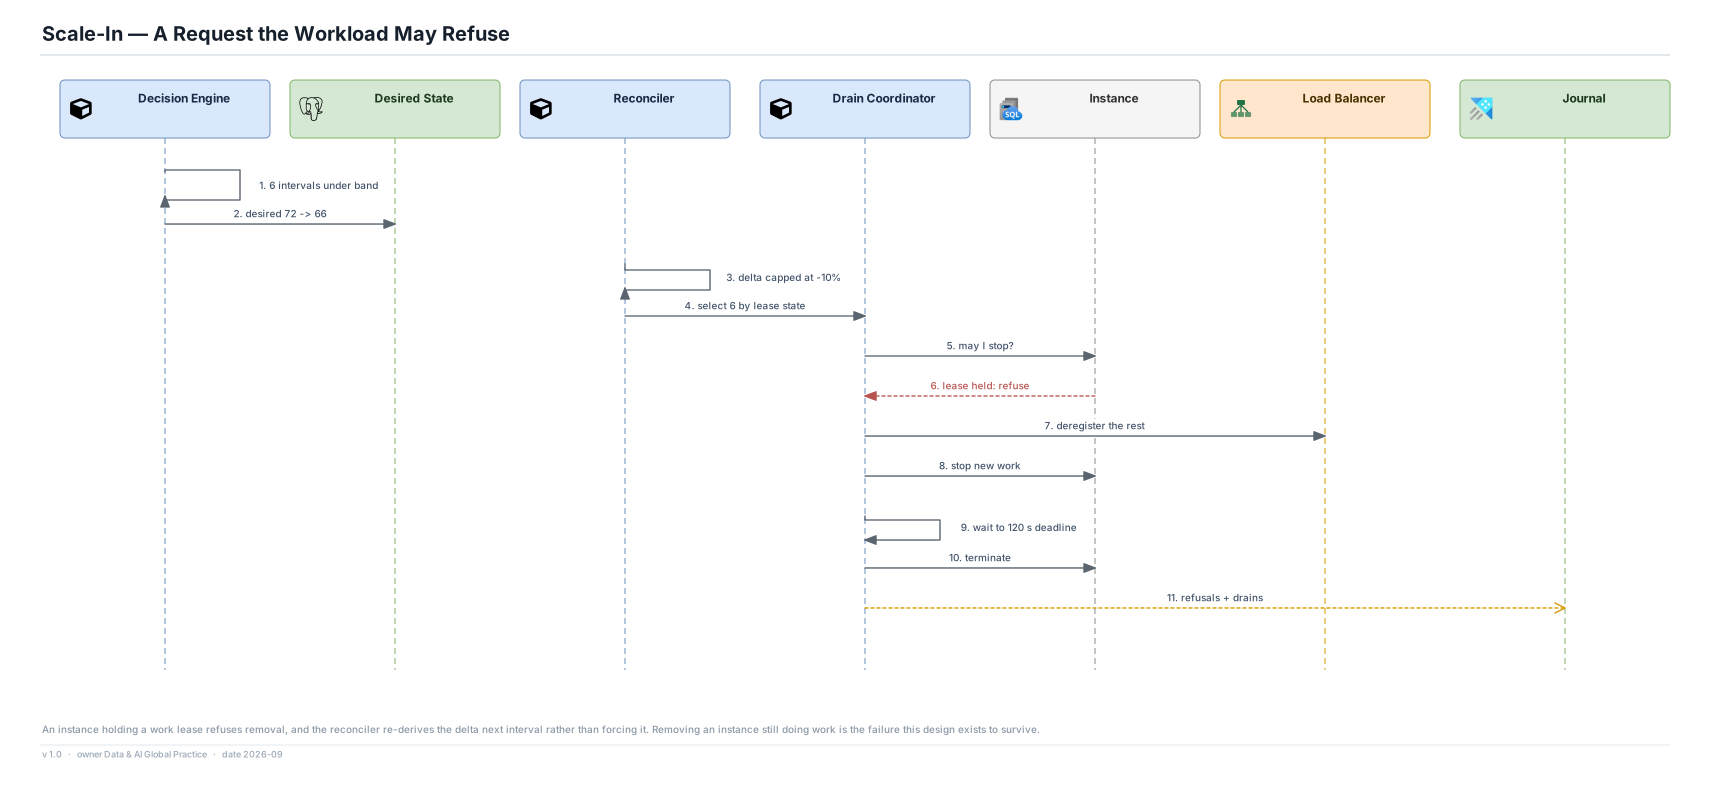
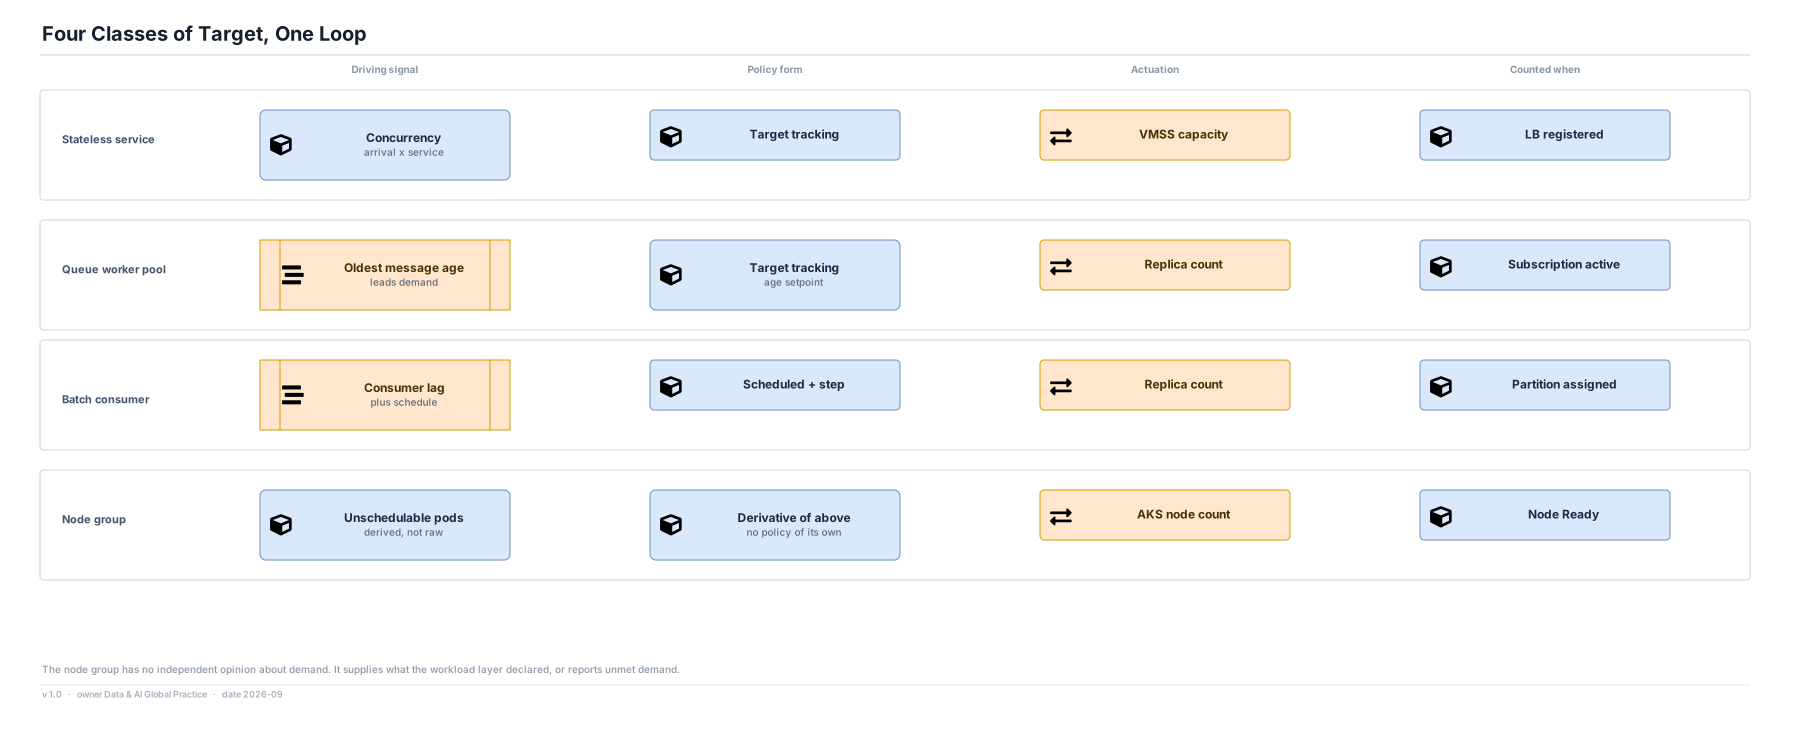
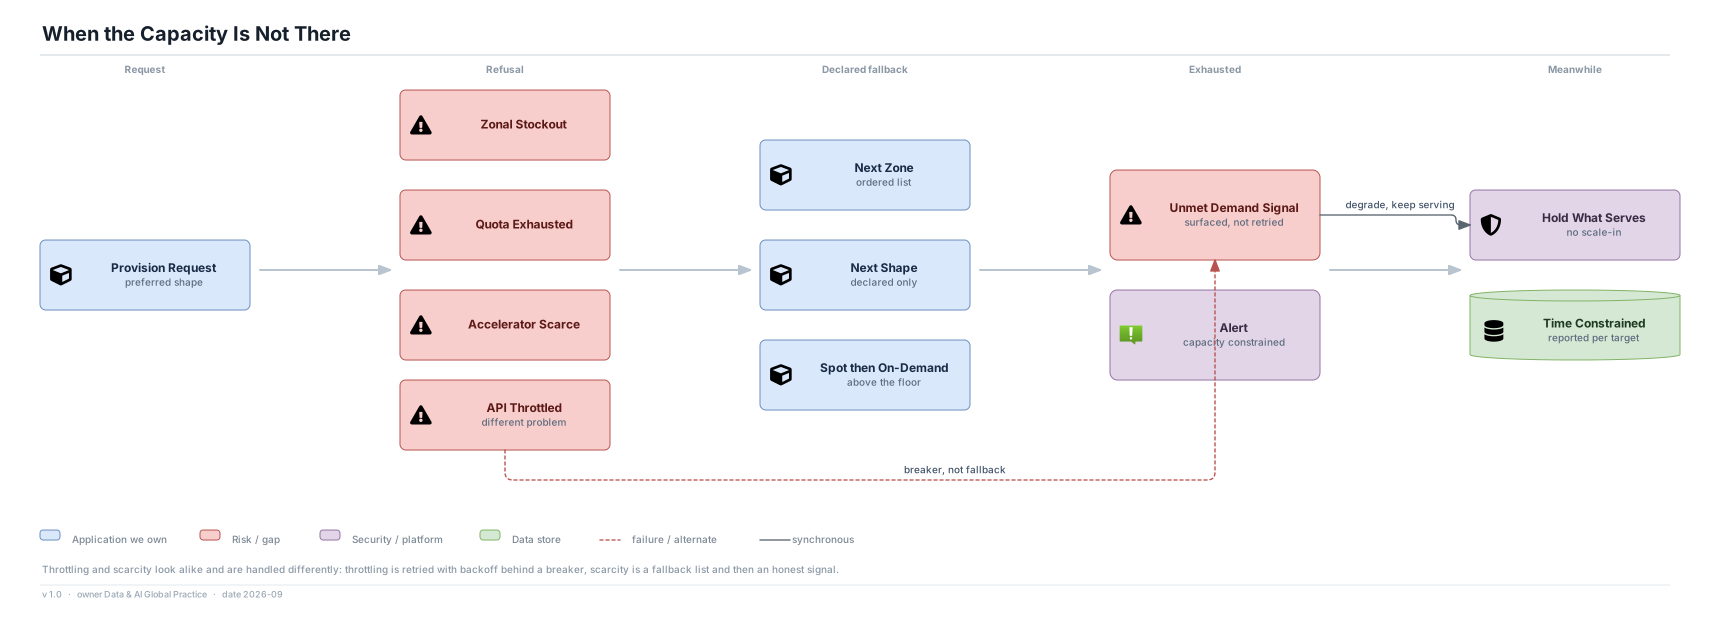
One interval end to end, how signals are ranked, how policies combine, what stops oscillation, and what happens on the way up, on the way down and when the capacity is not there.
Open svg/<view>.svg or drawio/<view>.drawio in draw.io Desktop or at app.diagrams.net to edit. The SVG carries the diagram inside it, so it is both the picture and the source. This folder is self-contained — copy it whole and every link still resolves.