Internal Developer Platform  ·  View 18 of 21  ·  Operations

Observability Matrix

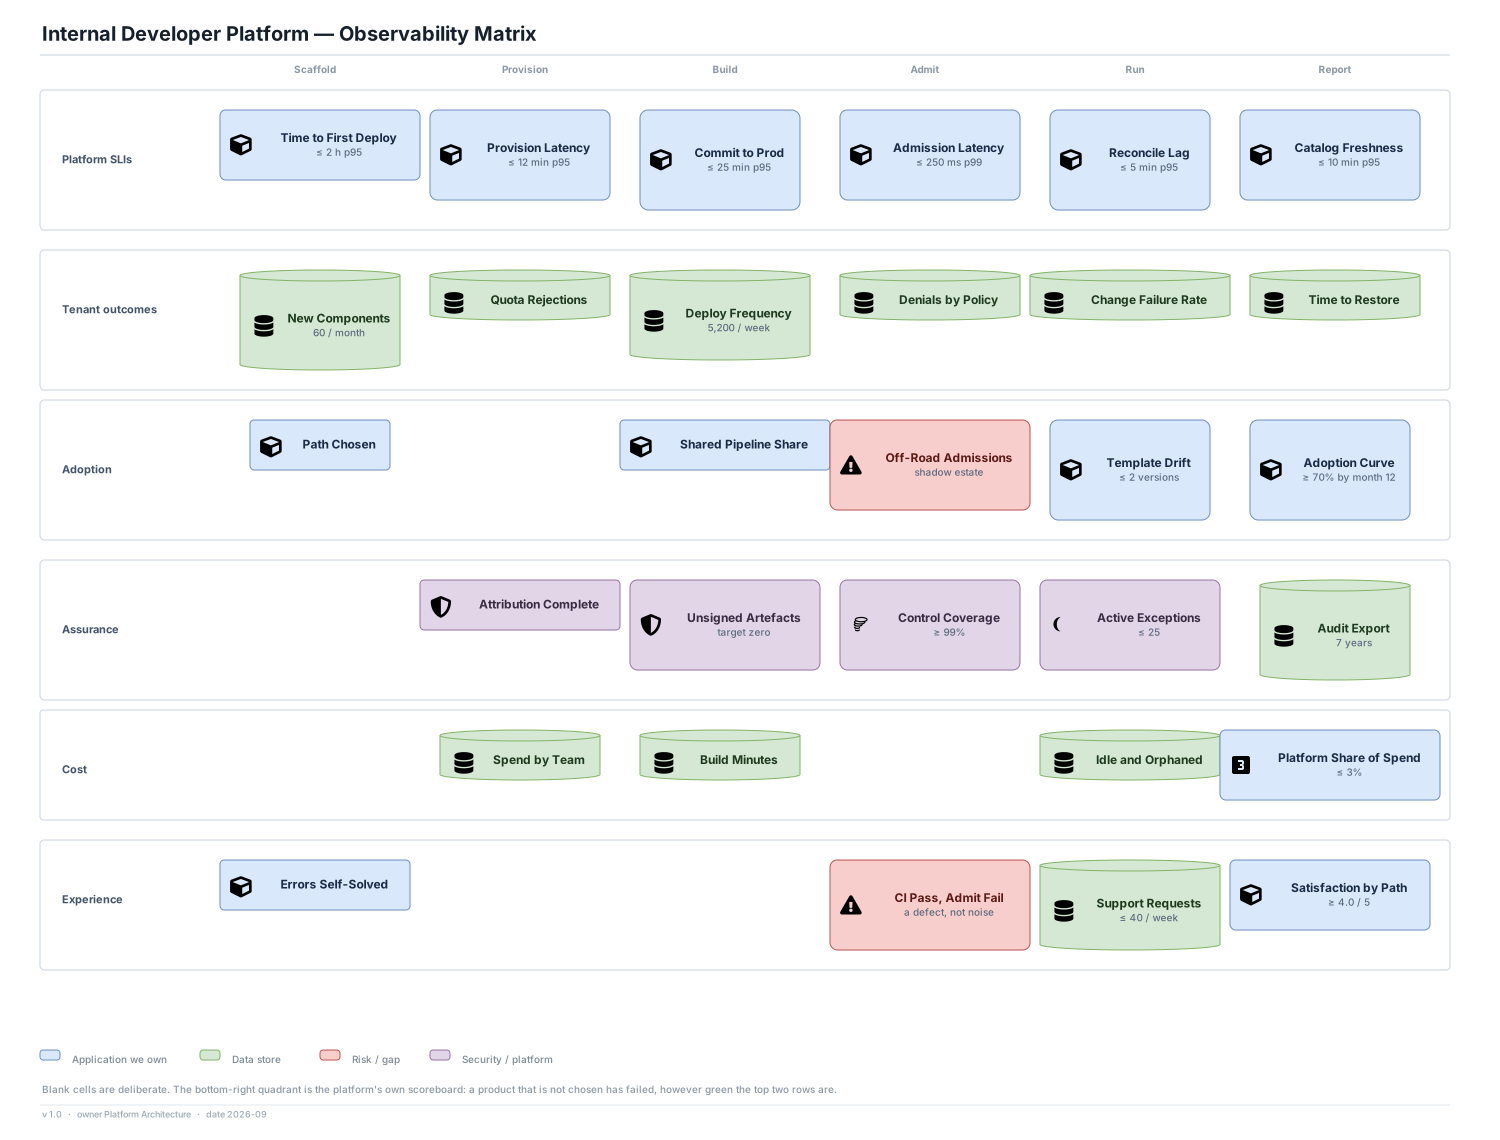
Six signal families across six stages, including the platform's own honest scoreboard.

Editable source SVG draw.io All views
Scaffold Provision Build Admit Run Report Platform SLIs Time to First Deploy ≤ 2 h p95 Provision Latency ≤ 12 min p95 Commit to Prod ≤ 25 min p95 Admission Latency ≤ 250 ms p99 Reconcile Lag ≤ 5 min p95 Catalog Freshness ≤ 10 min p95 Tenant outcomes New Components 60 / month Quota Rejections Deploy Frequency 5,200 / week Denials by Policy Change Failure Rate Time to Restore Adoption Path Chosen Shared Pipeline Share Off-Road Admissions shadow estate Template Drift ≤ 2 versions Adoption Curve ≥ 70% by month 12 Assurance Attribution Complete Unsigned Artefacts target zero Control Coverage ≥ 99% Active Exceptions ≤ 25 Audit Export 7 years Cost Spend by Team Build Minutes Idle and Orphaned Platform Share of Spend ≤ 3% Experience Errors Self-Solved CI Pass, Admit Fail a defect, not noise Support Requests ≤ 40 / week Satisfaction by Path ≥ 4.0 / 5 Internal Developer Platform — Observability Matrix Application we own Data store Risk / gap Security / platform Blank cells are deliberate. The bottom-right quadrant is the platform's own scoreboard: a product that is not chosen has failed, however green the top two rows are. v 1.0 · owner Platform Architecture · date 2026-09

Decisions

  • Tenant outcomes are measured as DORA metrics rather than platform activity: deploys served is a vanity number, change failure rate is not (ADR-12).
  • Off-road admissions are measured as the shadow estate, which is the platform's competitive metric — a bypassed platform has lost however green its own SLIs are.
  • CI-pass-then-admission-fail is instrumented as a defect class of its own, because it is the specific failure that destroys trust in advisory checks (ADR-06).

Targets

  • ≥ 70% of production components on a current golden path by month 12; shadow estate ≤ 10%; satisfaction ≥ 4.0 of 5 per path (stated assumptions).
  • Support ≤ 40 requests per week at 1,400 components, with ≥ 60% resolved without a platform engineer.

Reads as

  • Blank cells are statements: there is no cost signal at admission, and no scaffold-stage assurance signal, because nothing meaningful happens there.
  • The bottom two rows are what a platform-as-product review actually reads; the top two are what an SRE reads.