Edge Cache and CDN Platform  ·  View 24 of 29  ·  6 · Operations

Observability

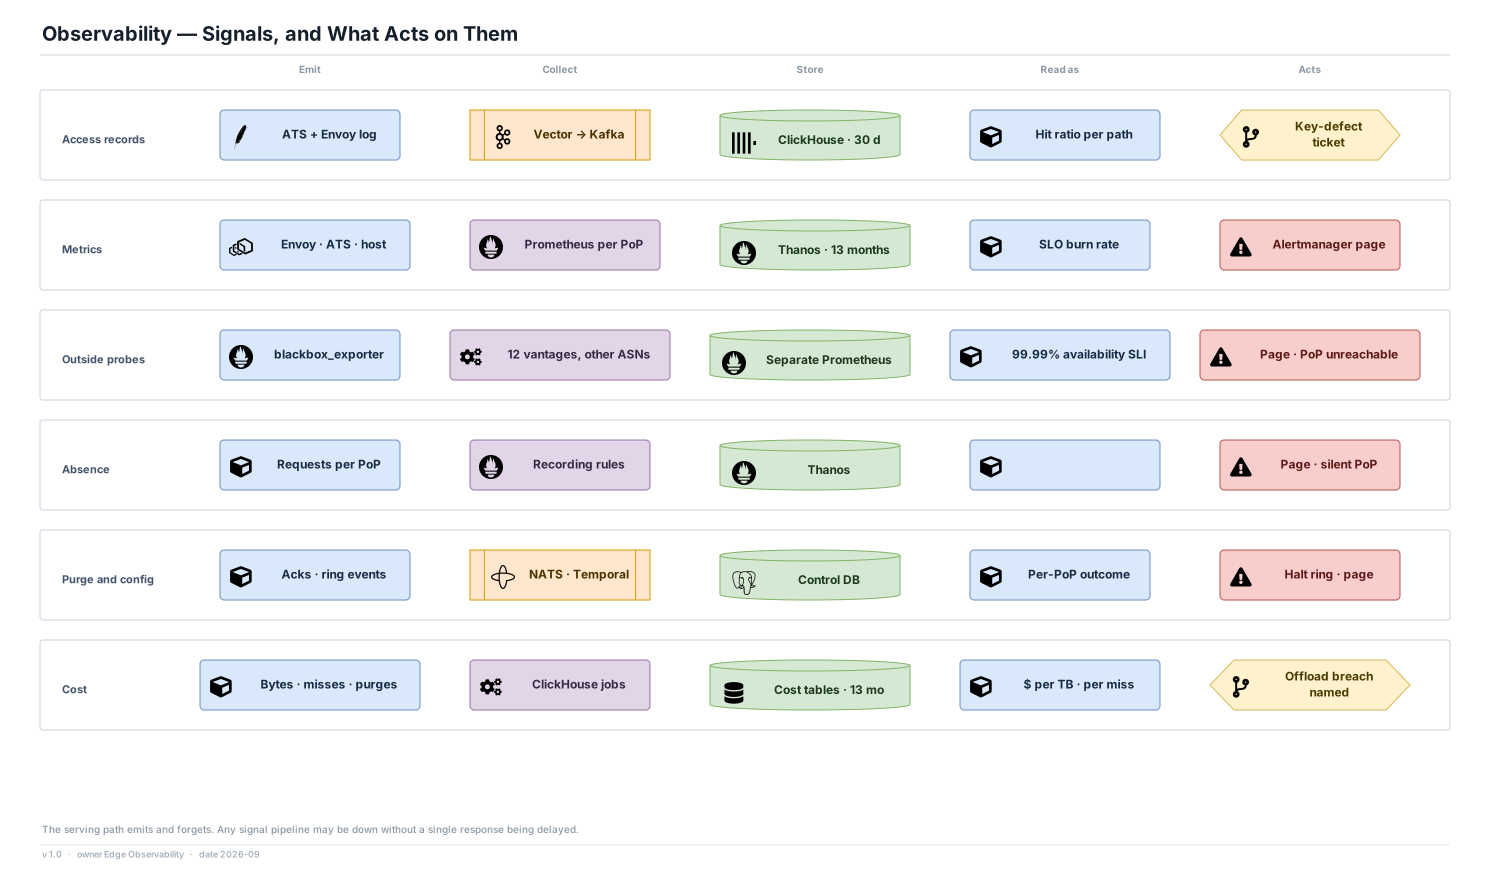
Six kinds of signal, where each is collected and stored, how it is read, and what acts on it.

Editable source SVG draw.io All views
Emit Collect Store Read as Acts Access records ATS + Envoy log Vector → Kafka ClickHouse · 30 d Hit ratio per path Key-defect ticket Metrics Envoy · ATS · host Prometheus per PoP Thanos · 13 months SLO burn rate Alertmanager page Outside probes blackbox_exporter 12 vantages, other ASNs Separate Prometheus 99.99% availability SLI Page · PoP unreachable Absence Requests per PoP Recording rules Thanos Page · silent PoP Purge and config Acks · ring events NATS · Temporal Control DB Per-PoP outcome Halt ring · page Cost Bytes · misses · purges ClickHouse jobs Cost tables · 13 mo $ per TB · per miss Offload breach named Observability — Signals, and What Acts on Them The serving path emits and forgets. Any signal pipeline may be down without a single response being delayed. v 1.0 · owner Edge Observability · date 2026-09

Decisions

  • Availability is measured from outside. The 99.99% SLI is the success rate seen by probes in twelve networks that are not ours, not the success rate in our own logs.
  • Absence of traffic pages. A black-holed PoP shows no errors from the inside, so a PoP serving less than 20% of its request rate for the same hour last week is treated as an incident.
  • Prometheus runs in every PoP with 15 days of local retention, so a PoP cut off from the core can still be diagnosed through out-of-band access.

Per path pattern

  • Hit ratio, byte hit ratio, stale-served ratio and refusal counts are published per path pattern as well as per property and PoP. A bad key only shows up at that level.

Numbers

  • Delivery SLO 99.99% monthly across the anycast set; purge API 99.95%; configuration control plane 99.9%. Single-PoP availability is deliberately not a target.