Distributed Lock Service  ·  View 21 of 26  ·  6 · Operations

Observability — Signals and What Acts on Them

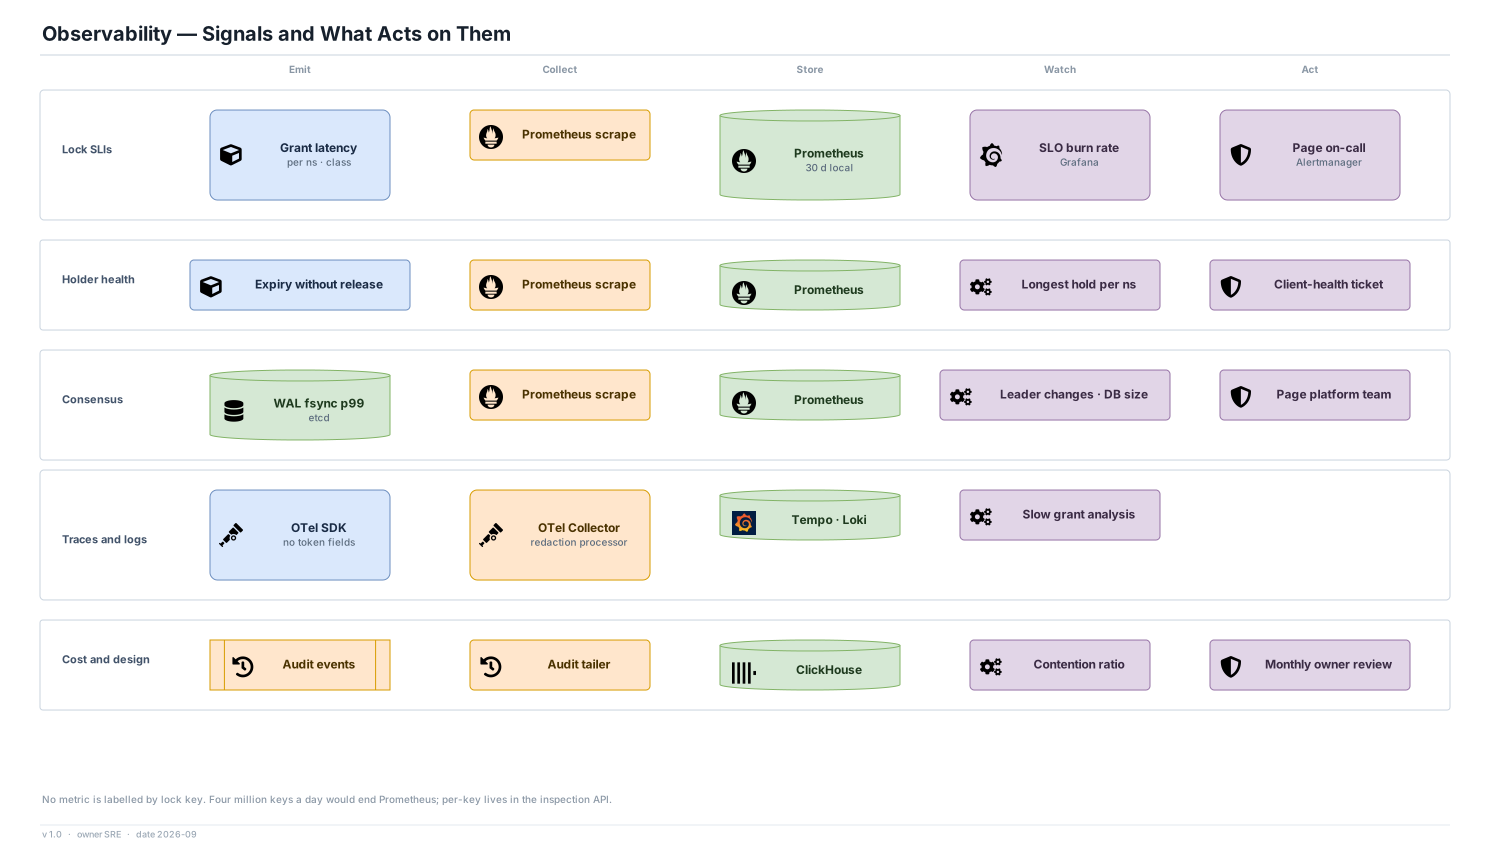
Five signal families, each with a store, a watcher and a named action, and the one label that is never used.

Editable source SVG draw.io All views
Emit Collect Store Watch Act Lock SLIs Grant latency per ns · class Prometheus scrape Prometheus 30 d local SLO burn rate Grafana Page on-call Alertmanager Holder health Expiry without release Prometheus scrape Prometheus Longest hold per ns Client-health ticket Consensus WAL fsync p99 etcd Prometheus scrape Prometheus Leader changes · DB size Page platform team Traces and logs OTel SDK no token fields OTel Collector redaction processor Tempo · Loki Slow grant analysis Cost and design Audit events Audit tailer ClickHouse Contention ratio Monthly owner review Observability — Signals and What Acts on Them No metric is labelled by lock key. Four million keys a day would end Prometheus; per-key lives in the inspection API. v 1.0 · owner SRE · date 2026-09

Decisions

  • Lock metrics are labelled by namespace and class only. The per-key question is answered by the inspection API, which reads etcd, not by a time series.
  • Expiry without release is a client-health signal routed to the owning team, not an error rate on the platform. It means holders are dying or pausing, which is a fencing question.
  • Longest current hold per namespace is a first-class gauge, because the oldest hold is the most likely leak.

Consensus health

  • WAL fsync p99 above 10 ms, backend commit p99 above 25 ms, more than one leader change an hour and DB size above 70% of quota each page the platform team. Each precedes a grant-latency incident by minutes.

The token is a capability

  • Client libraries never put the token in a span attribute, log line or error message. The OTel Collector also runs a redaction processor on the lock.token attribute, as a second line rather than the first.