Customer 360 Enterprise Data Platform — Denodo on Azure · View 31 of 39 · Operations
The test this matrix applies
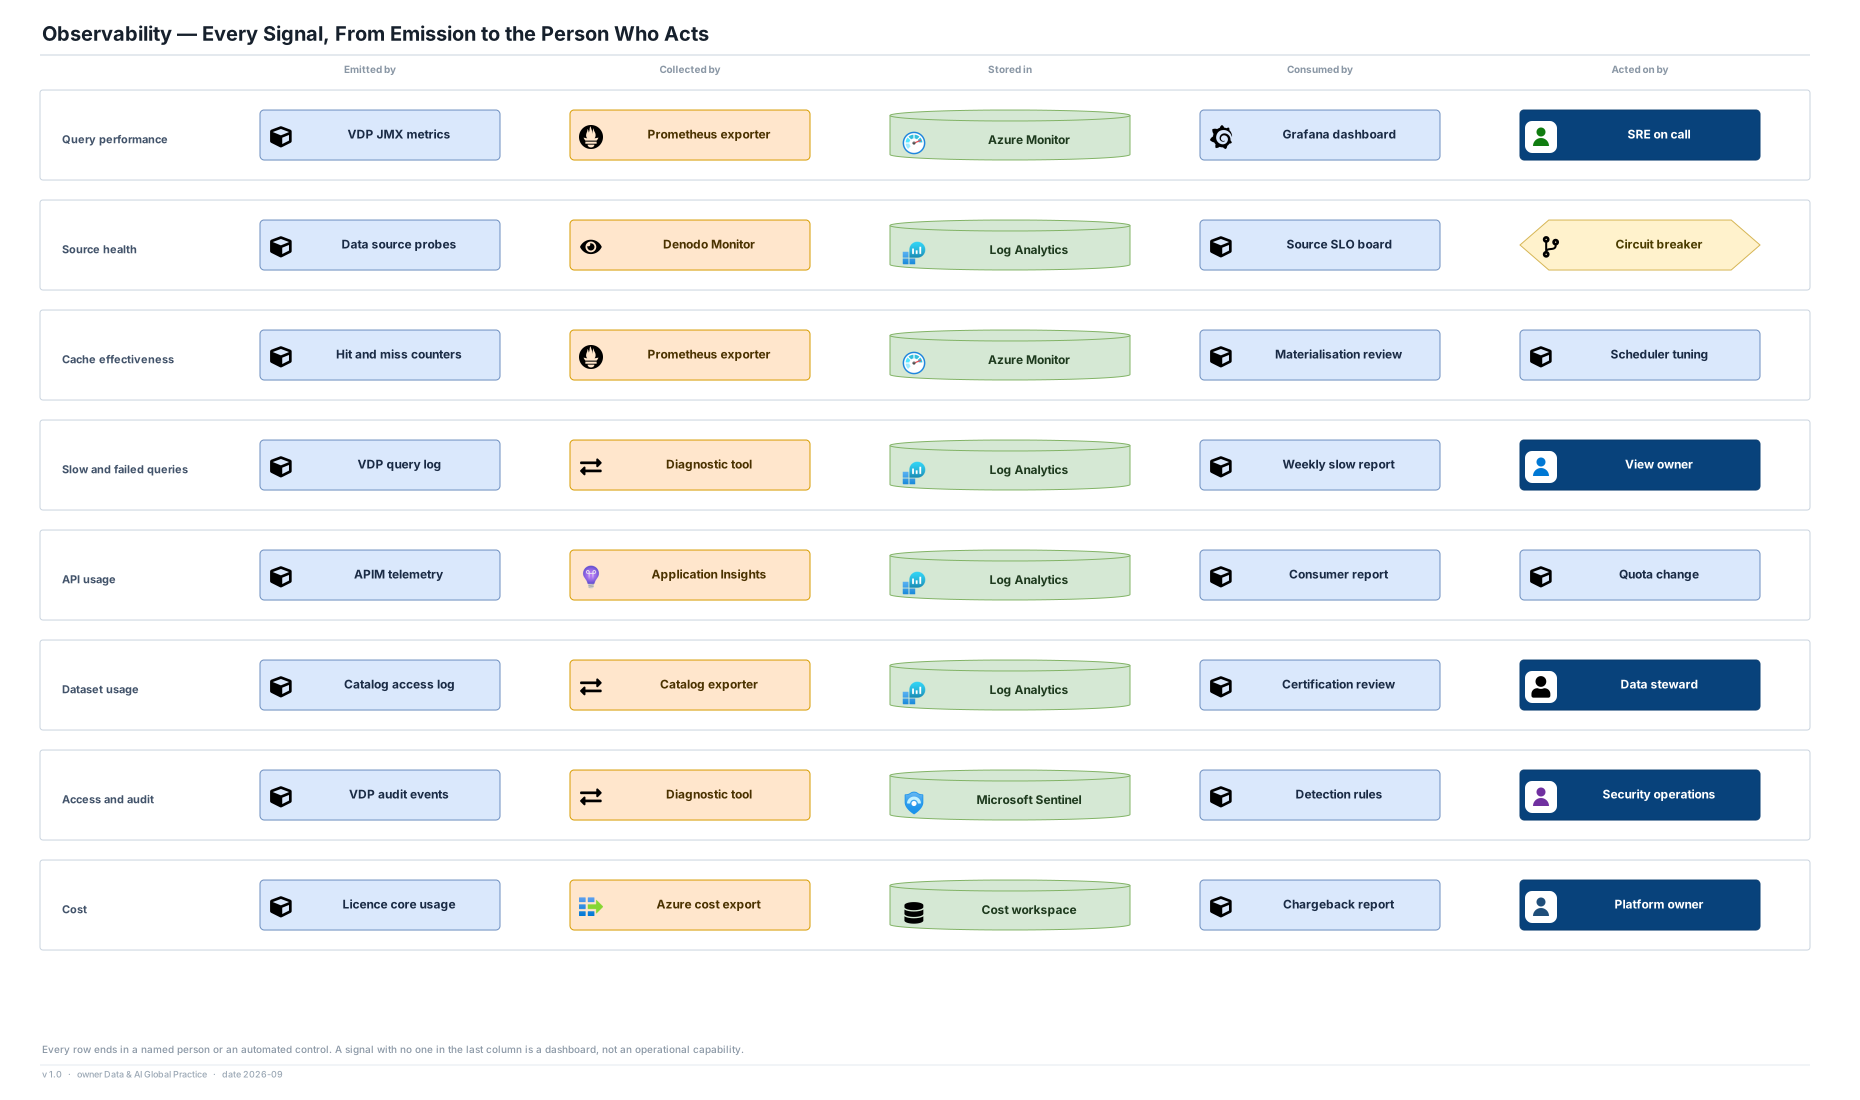
- Every row ends in a named person or an automated control. A signal with no one in the last column is a dashboard, not an operational capability.
- Source health is separated from query performance, because the most common incident is a healthy platform in front of a degraded source and the two must not share an alert.
- Dataset usage is an operational signal, not a governance nicety — it drives certification review and the materialisation loop on view 32.
Tooling
- Denodo JMX metrics through a Prometheus exporter into Azure Monitor, with Grafana for the engineering views and Azure workbooks for the service views.
- Audit events go to Microsoft Sentinel on a one-way path; the platform's own operators cannot alter them.
Gaps this view makes visible
- There is no automated control on shadow copies — an extract in a spreadsheet is invisible once it leaves. Usage telemetry narrows it; nothing closes it. It is named as a failure mode on view 39 rather than pretended away.