Service Mesh Platform  ·  View 25 of 31  ·  6 · Operations

Observability

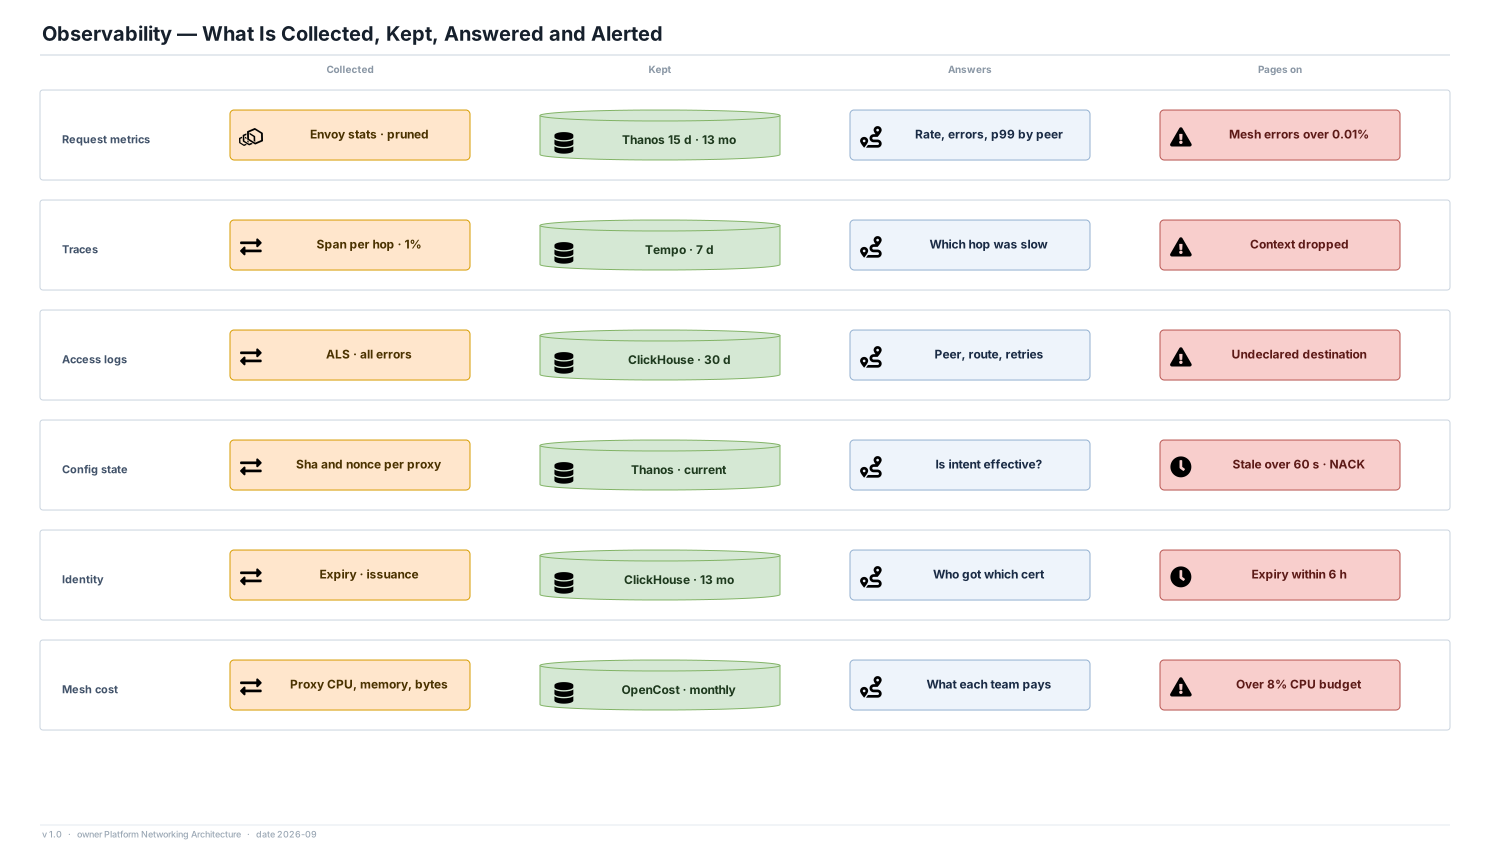
Six signal types, where each is kept and for how long, the question it answers, and the condition that pages someone.

Editable source SVG draw.io All views
Collected Kept Answers Pages on Request metrics Envoy stats · pruned Thanos 15 d · 13 mo Rate, errors, p99 by peer Mesh errors over 0.01% Traces Span per hop · 1% Tempo · 7 d Which hop was slow Context dropped Access logs ALS · all errors ClickHouse · 30 d Peer, route, retries Undeclared destination Config state Sha and nonce per proxy Thanos · current Is intent effective? Stale over 60 s · NACK Identity Expiry · issuance ClickHouse · 13 mo Who got which cert Expiry within 6 h Mesh cost Proxy CPU, memory, bytes OpenCost · monthly What each team pays Over 8% CPU budget Observability — What Is Collected, Kept, Answered and Alerted v 1.0 · owner Platform Networking Architecture · date 2026-09

Decisions

  • The page is on mesh-attributed errors above 0.01%, not on total errors. The mesh's availability target is about the failures it causes.
  • Config state is a metric. Acknowledged sha, nonce and proxy version per proxy are exported, so 'is this change live?' is a PromQL query, not a round of istioctl commands.
  • Certificate expiry pages at six hours remaining on any proxy. Discovering expiry from an outage is the failure mode the requirement names explicitly.

Targets

  • Metrics 15 days raw and 13 months at 5-minute and 1-hour resolution. Traces 7 days. Access logs 30 days. Issuance 13 months.

Deliberately out

  • A mesh topology UI as a source of truth. Kiali-style graphs are useful for exploring, but alerts and gates read Thanos directly.