Service Mesh Platform · View 15 of 31 · 4 · Data
Decisions
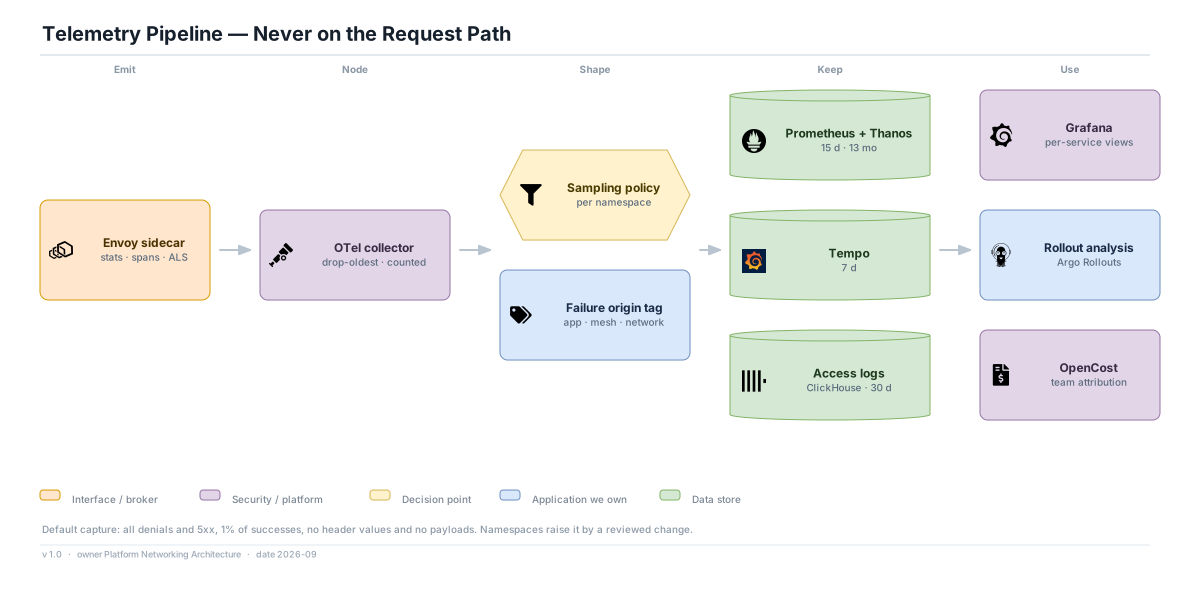
- Every failure is tagged with its origin (application, mesh policy or configuration, or network between proxies) from Envoy's response flags. "The mesh is broken" and "your service returned 500" are different pages to different teams.
- Sampling is set per namespace with a default of all denials and errors plus 1% of successes. Telemetry, not proxying, is where mesh cost runs away.
- The node collector drops the oldest data when its buffer is full and counts what it dropped. A slow telemetry backend never slows a request.
Privacy defaults
- No payloads and no values of authorisation-relevant headers are logged. Turning either on is a reviewed change scoped to one service with an expiry date, and the change itself is audited.
Assumptions
- Label cardinality is pruned at the proxy to source identity, destination service, subset and response class. Per-pod labels are dropped at scrape; they cost more than they explain at 40,000 proxies.