LinkedIn Professional Network  ·  View 24 of 30  ·  6 · Operations

Observability and Operations

How anyone knows the network is working, and who gets woken up when it is not.

Editable source SVG draw.io All views
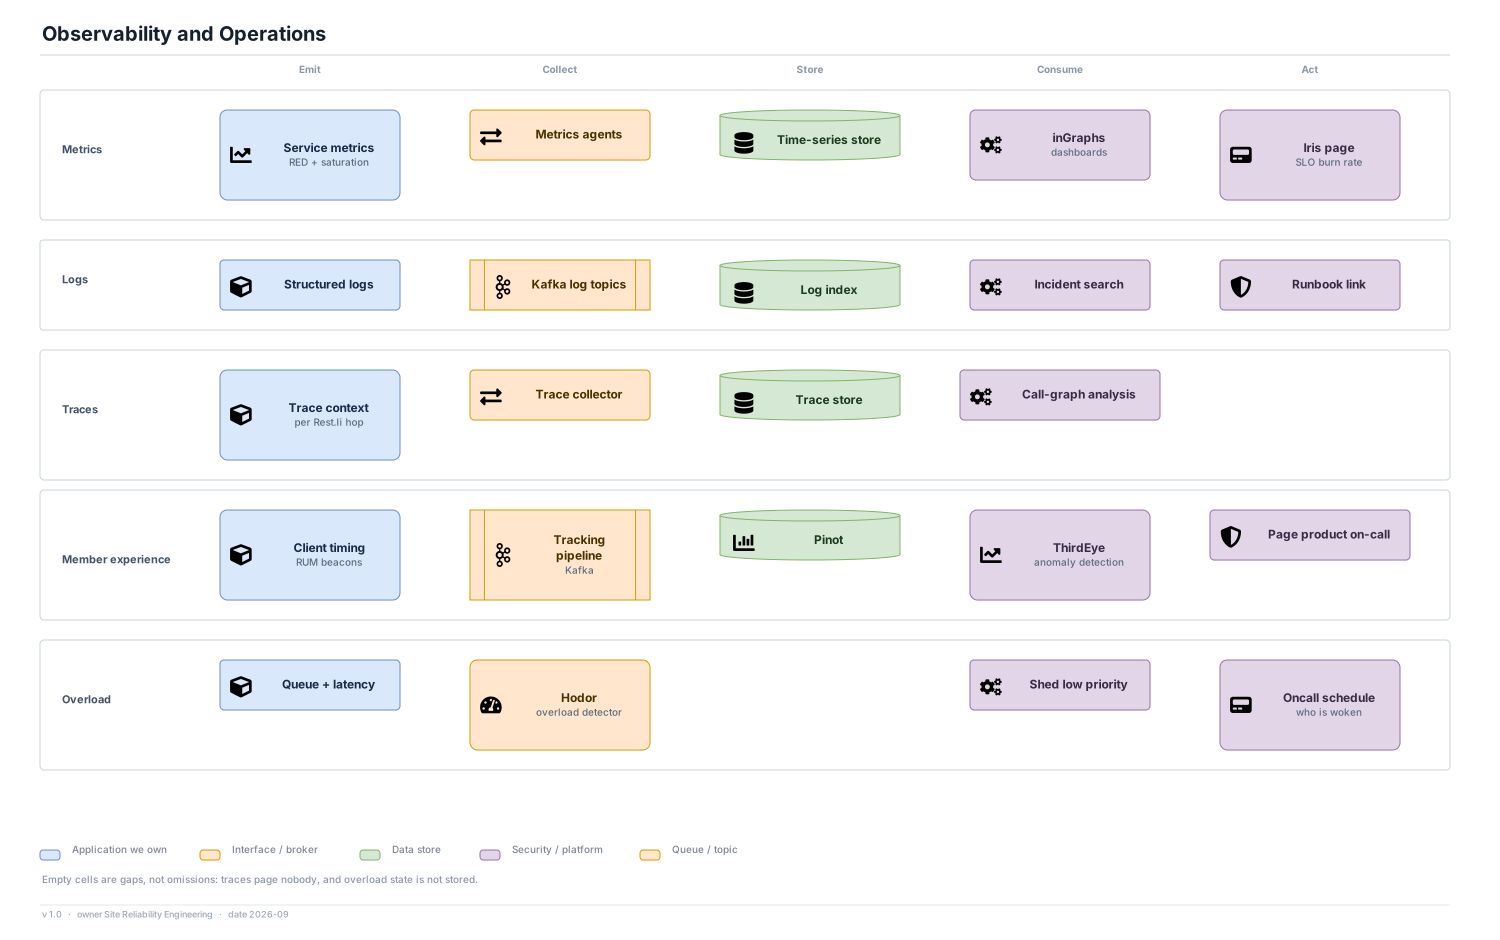
Emit Collect Store Consume Act Metrics Service metrics RED + saturation Metrics agents Time-series store inGraphs dashboards Iris page SLO burn rate Logs Structured logs Kafka log topics Log index Incident search Runbook link Traces Trace context per Rest.li hop Trace collector Trace store Call-graph analysis Member experience Client timing RUM beacons Tracking pipeline Kafka Pinot ThirdEye anomaly detection Page product on-call Overload Queue + latency Hodor overload detector Shed low priority Oncall schedule who is woken Observability and Operations Application we own Interface / broker Data store Security / platform Queue / topic Empty cells are gaps, not omissions: traces page nobody, and overload state is not stored. v 1.0 · owner Site Reliability Engineering · date 2026-09

Decisions

  • Alerts page on SLO burn (errors and latency members can see), never on CPU alone
  • ThirdEye watches business metrics in Pinot. It catches a drop in feed engagement while every host is green
  • Hodor detects overload and sheds low-priority traffic before a service falls over (LinkedIn, 2022)

Tools

  • inGraphs, EKG, ThirdEye, Iris and Oncall are LinkedIn tools; Iris and Oncall have been open source since 2017
  • Tracing is drawn generically because LinkedIn has not published its current tracer. OpenTelemetry is the portable choice

Gaps, shown on purpose

  • Traces page nobody; a latency regression is caught on the metrics row
  • Overload state is not stored, so analysis after an incident relies on metrics