Backup and Restore Service · View 15 of 26 · 5 · Runtime
Decisions
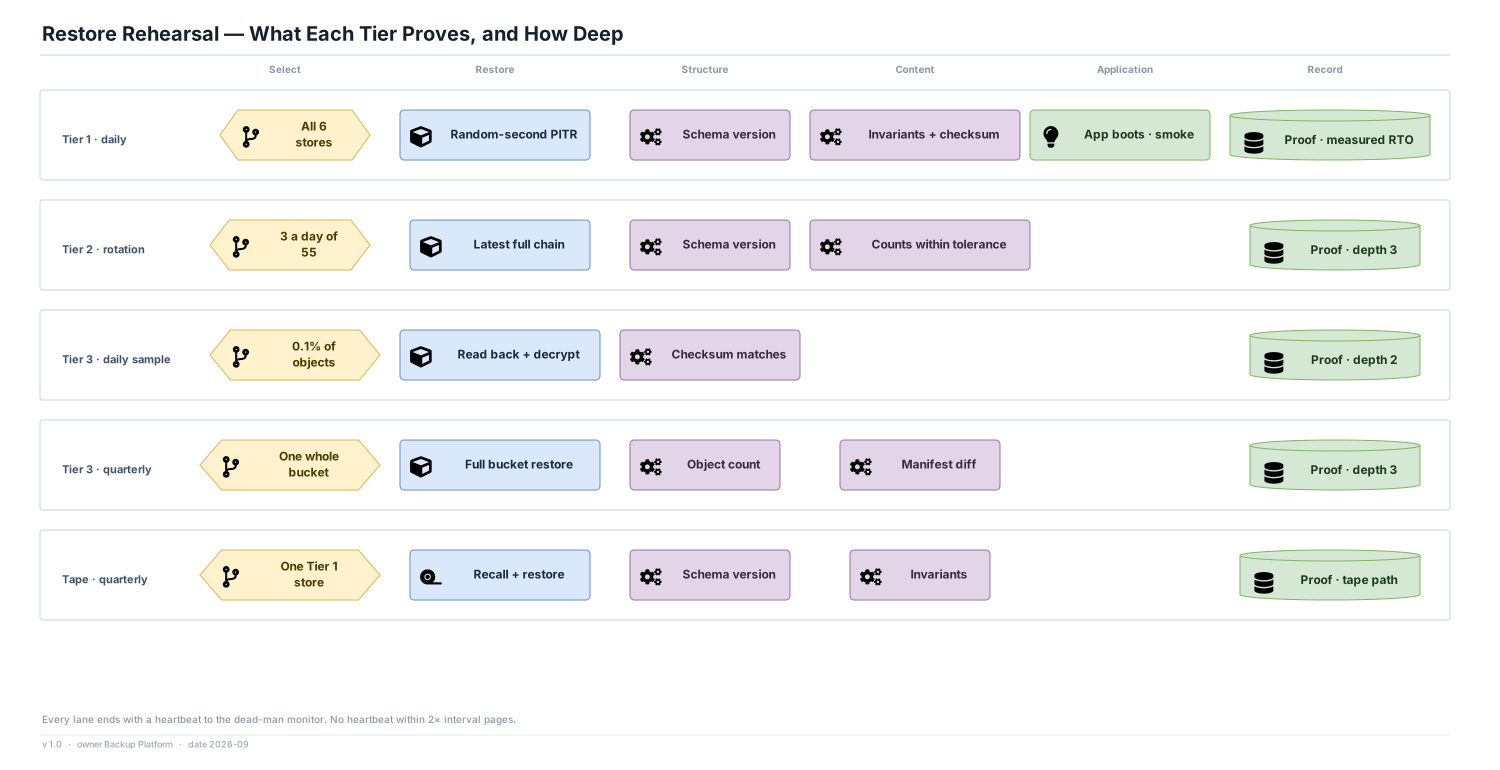
- Depth is chosen per tier by which failures it catches. Depth 1 catches unreadable copies. Depth 2 catches wrong or partial restores. Depth 3 catches silent data loss. Depth 4 catches a copy that is intact but unusable, such as a missing extension, a role the application expects, or a sequence behind its table.
- Tier 1 rehearsals pick a random second in the last 24 hours, not the latest point. Always restoring to 'now' never exercises the replay path an incident usually needs.
- Rehearsals alternate between custody A and custody B, so the cross-data-centre restore is measured every other day instead of being assumed.
Numbers
- Tier 1: 6 full restores a day, about 12 TB read. Tier 2: 3 a day across 55 datastores, so each is proven about every 18 days against a 30-day requirement, which leaves room for a failure and a retry.
- Tier 3 sample: 0.1% of objects a day, about 1.3 TB, drawn without replacement, so a quarter covers about 9% of objects. The chance of missing a corruption that affects k objects is 0.91^k, which drops below 5% once 32 objects are affected. That figure is published next to the sample rate.
Risks
- Content checks compare against a probe taken on the source at a recorded log position. They sample cold key ranges so rows written in between do not cause false failures. A team that never writes an invariant stays at depth 2, and the report says so.