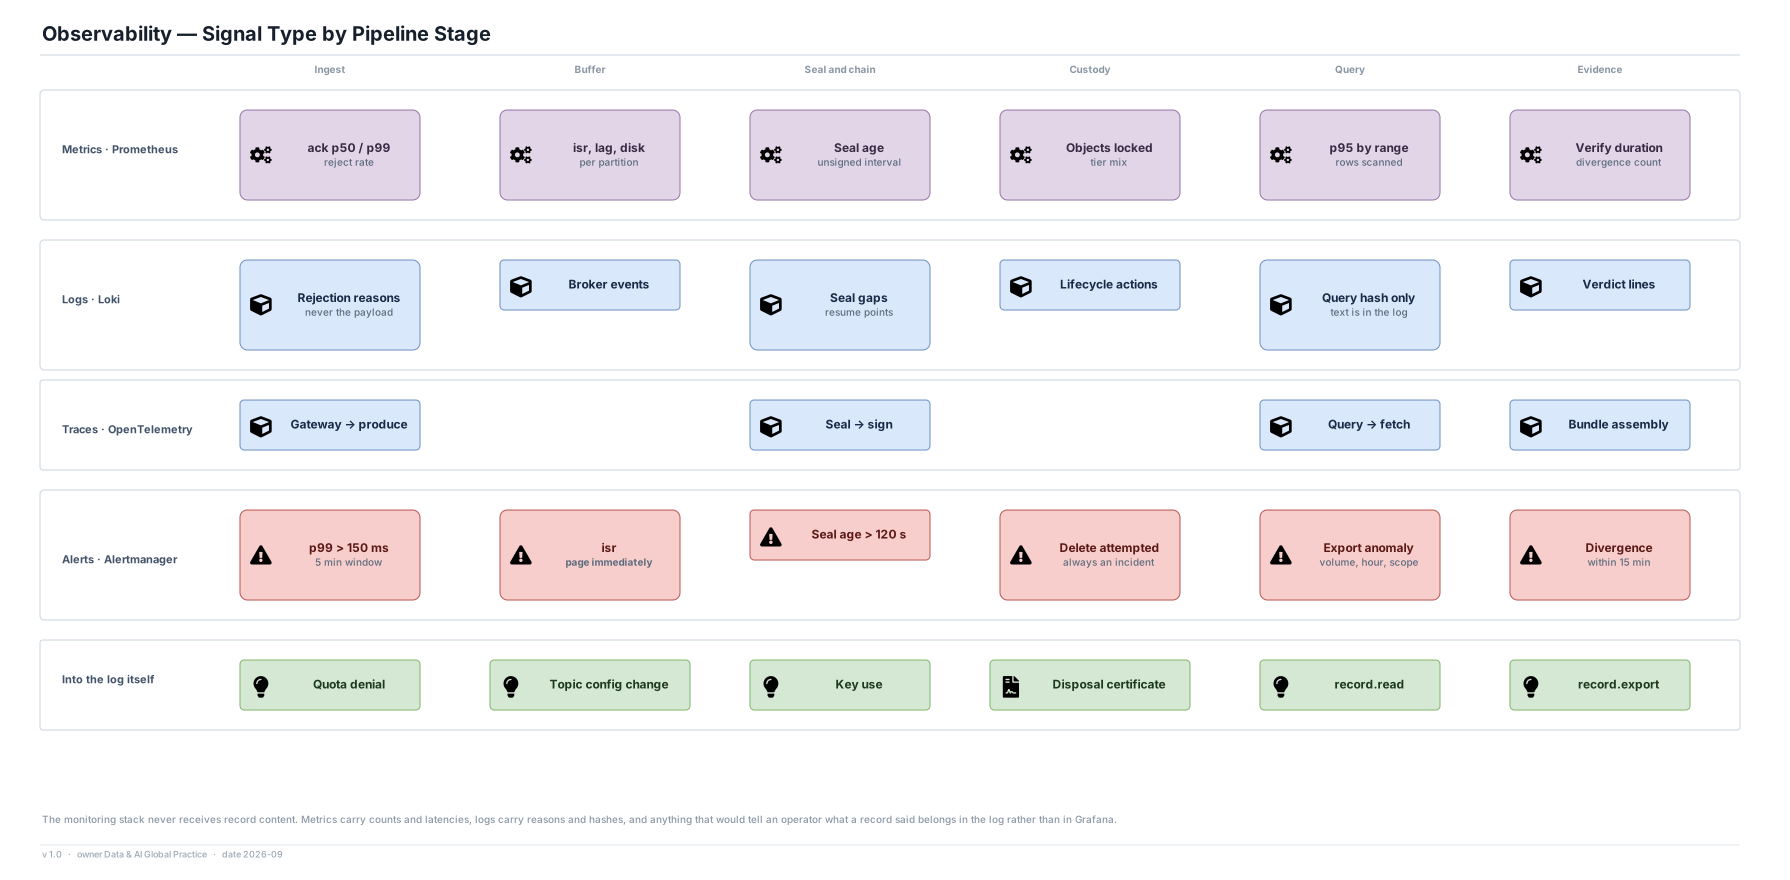
The monitoring stack never receives record content. Metrics carry counts and latencies; logs carry reasons and query hashes. Anything that would tell an operator what a record said belongs in the log, not in Grafana.
The bottom row is the point: six categories of event that the service writes about itself, into itself. Quota denials, topic configuration changes, key use, disposal certificates, reads and exports.
Alerts are named after a runbook, not after a threshold. An operator woken at 3 a.m. by 'seal age > 120 s' gets a page that tells them the buffer is absorbing it and what the deadline is.
The alerts that matter
Any attempted delete on the segment container: always an incident, never a warning.
Chain divergence: paged within 15 minutes of detection.
Export anomaly by volume, hour or scope: the realistic exfiltration signal, and the one an operator cannot investigate themselves because they cannot read records.
Assumptions
Detections flow to Microsoft Sentinel as an alert feed. Sentinel is a consumer of signals about this service, never a copy of it — a second searchable copy of the audit corpus outside the custody plane would defeat the access model.