Storage Tiering Service  ·  View 25 of 31  ·  6 · Operations

Observability

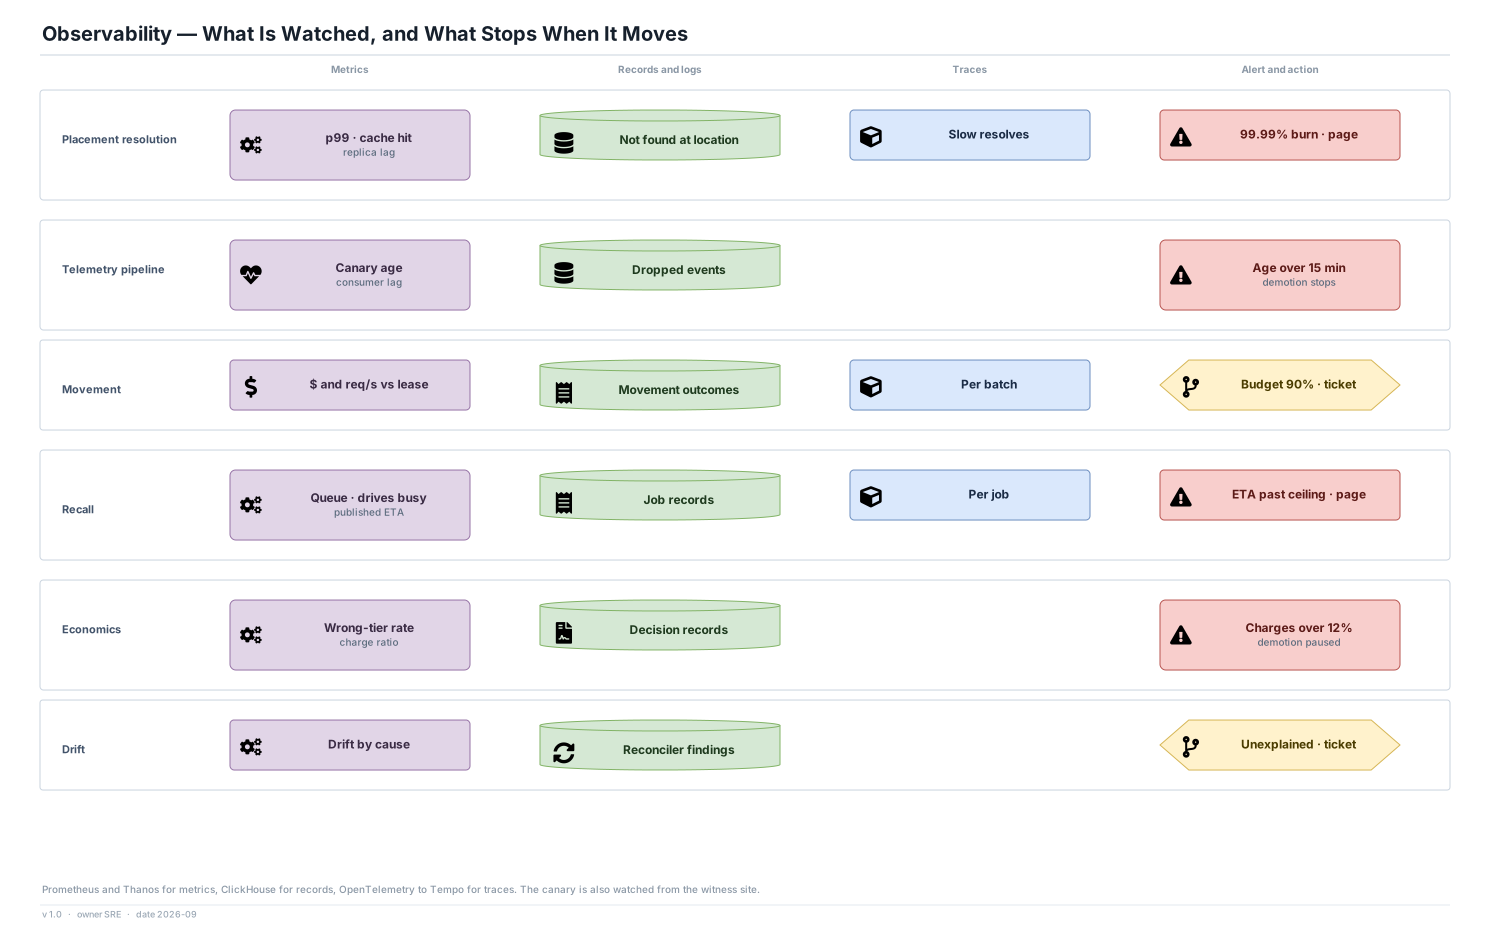
Six things that are watched, what records them, and the action each alert takes, several of which stop the platform rather than page a person.

Editable source SVG draw.io All views
Metrics Records and logs Traces Alert and action Placement resolution p99 · cache hit replica lag Not found at location Slow resolves 99.99% burn · page Telemetry pipeline Canary age consumer lag Dropped events Age over 15 min demotion stops Movement $ and req/s vs lease Movement outcomes Per batch Budget 90% · ticket Recall Queue · drives busy published ETA Job records Per job ETA past ceiling · page Economics Wrong-tier rate charge ratio Decision records Charges over 12% demotion paused Drift Drift by cause Reconciler findings Unexplained · ticket Observability — What Is Watched, and What Stops When It Moves Prometheus and Thanos for metrics, ClickHouse for records, OpenTelemetry to Tempo for traces. The canary is also watched from the witness site. v 1.0 · owner SRE · date 2026-09

Decisions

  • Three alerts act without a human: stale telemetry stops demotion, a charge ratio above 12% pauses demotion, and a failed ring gate freezes the policy. People are paged for the state, not asked to make the stop.
  • The telemetry canary is checked from the witness site by a self-hosted Healthchecks instance. A pipeline that stops sending looks identical to a quiet corpus to any monitor that only watches for errors.
  • Resolution SLO alerts use multi-window burn rates against 99.99%, because a 4-minute monthly budget is spent before a threshold alert fires.

Stack

  • Prometheus with Thanos for metrics, 13 months. Decision, movement and recall records in ClickHouse. OpenTelemetry traces to Tempo, sampled except for slow resolves and failed movements. Grafana over all three.

Numbers

  • Wrong-tier read rate at most 0.05% of reads; unread rehydrations at most 3% of bytes; platform cost at most 8% of net saving, reported monthly.