Feature Store · View 17 of 21 · Operations
Decisions
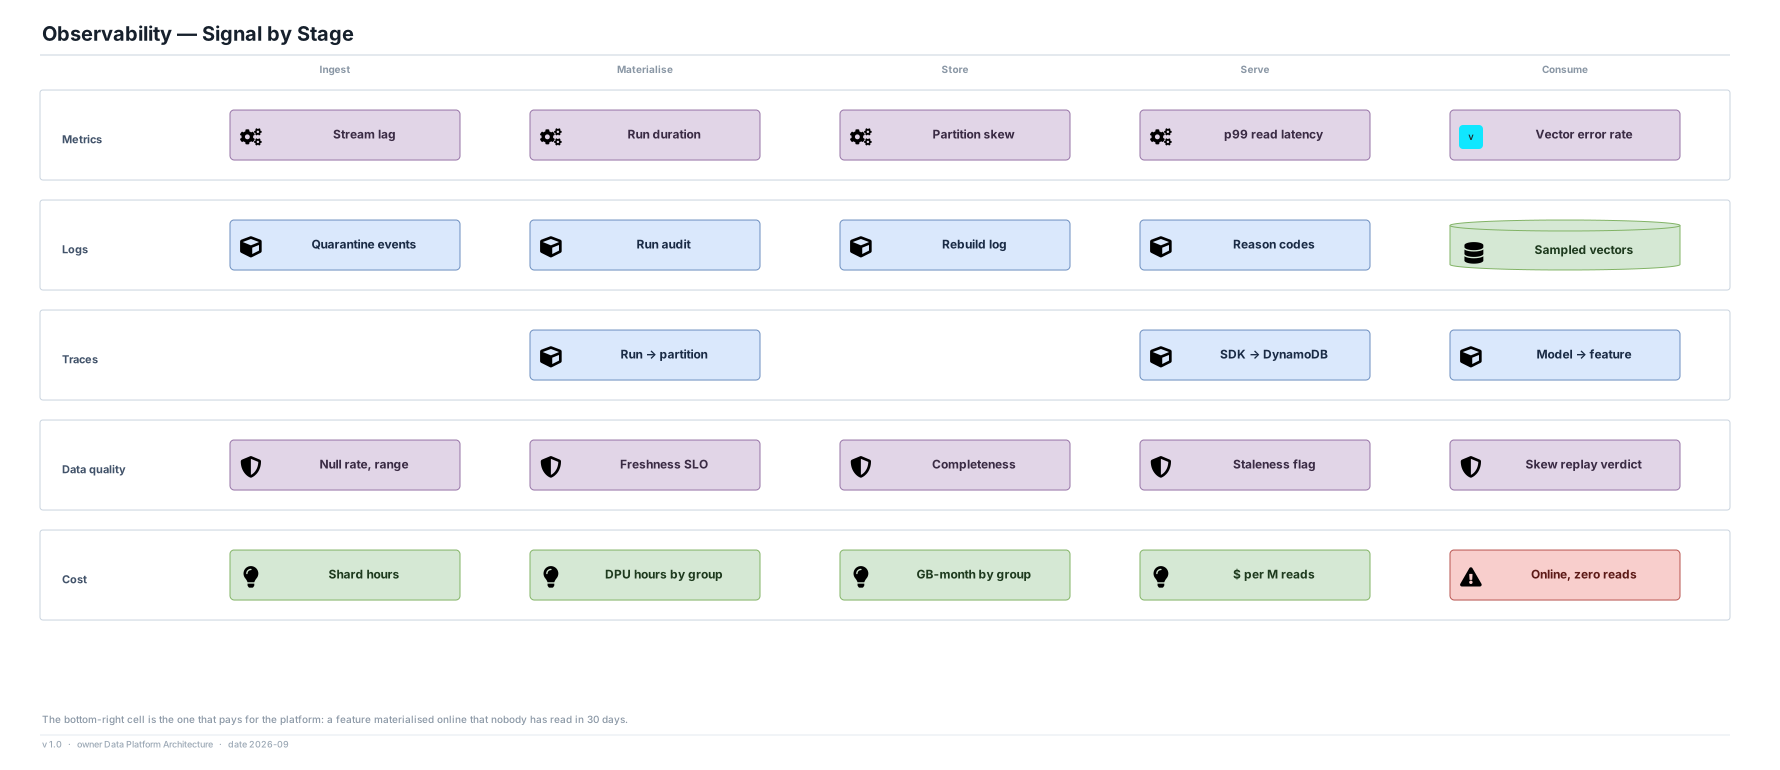
- Data quality is a first-class signal row alongside metrics, logs and traces, because this platform's characteristic failure is a plausible wrong number rather than an error.
- Streaming lag is an SLO, not a dashboard metric: past its threshold a group is marked stale rather than allowed to look fresh.
- Cost is measured per feature group, which is what makes the online/offline materialisation flag an accountable decision instead of a default.
Assumptions
- Target ≤ $0.40 per million feature-vector reads; features materialised online with zero reads in 30 days are reported to their owner.
- Skew and drift measurements retained 13 months so a slow regression can be dated.
Risks
- Three trace cells are deliberately empty. Tracing a write path through a windowed aggregate is expensive and rarely answers the question; the run audit does it more cheaply.