CI/CD Platform  ·  View 18 of 22  ·  Operations

Observability Coverage

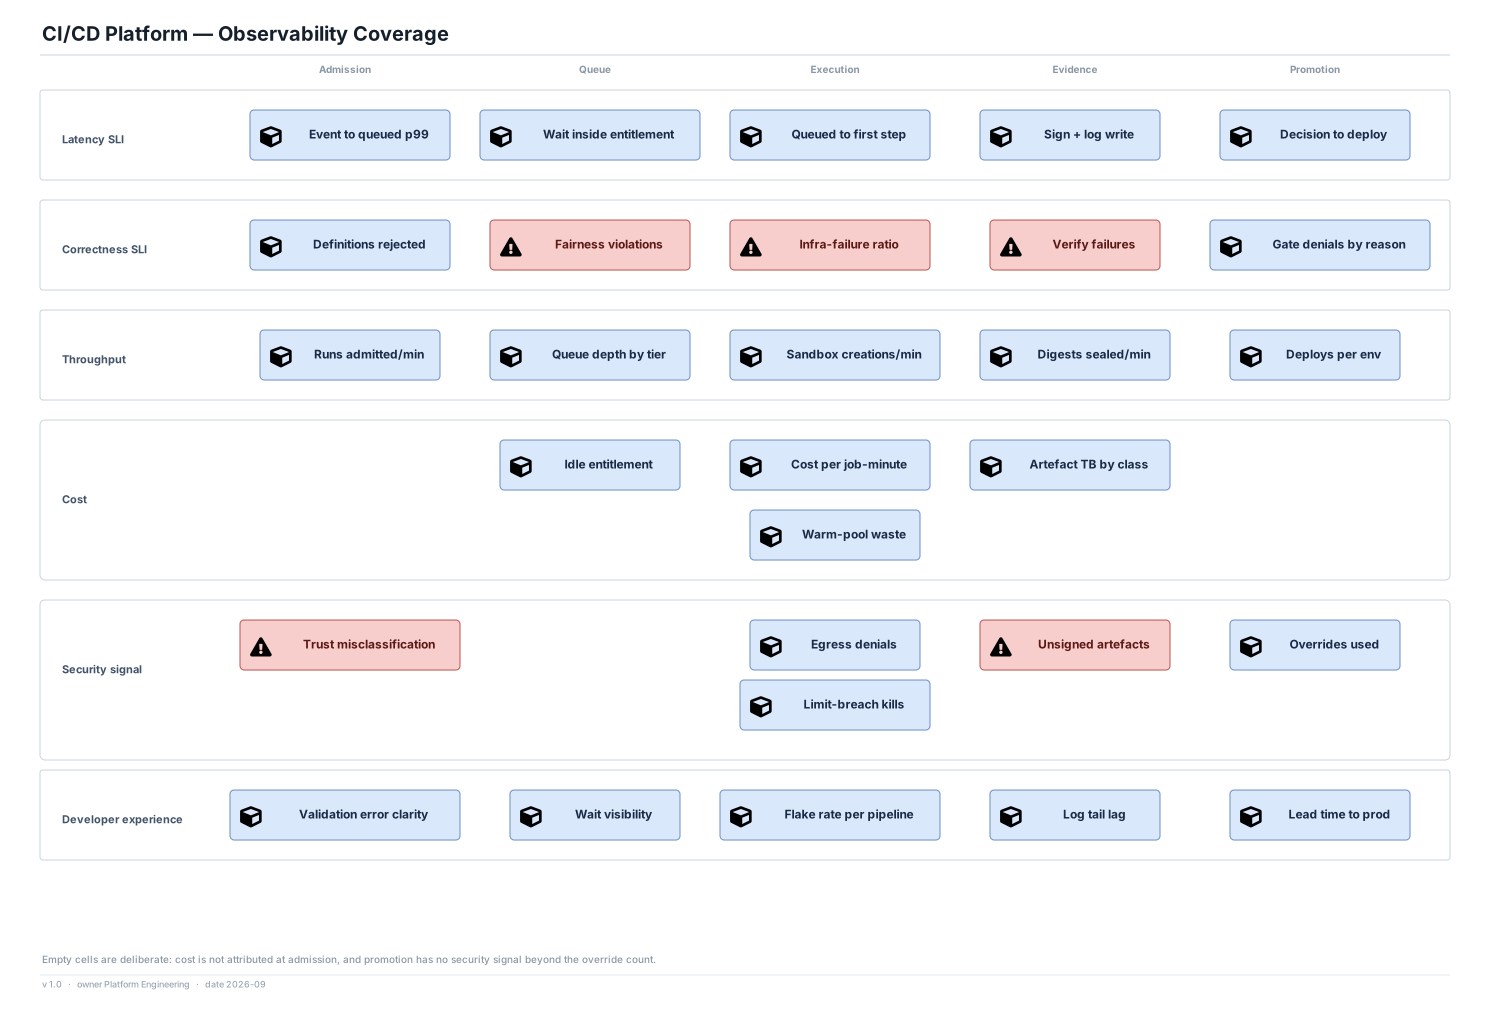
Six signal families across five pipeline stages, and the empty cells are statements.

Editable source SVG draw.io All views
Admission Queue Execution Evidence Promotion Latency SLI Event to queued p99 Wait inside entitlement Queued to first step Sign + log write Decision to deploy Correctness SLI Definitions rejected Fairness violations Infra-failure ratio Verify failures Gate denials by reason Throughput Runs admitted/min Queue depth by tier Sandbox creations/min Digests sealed/min Deploys per env Cost Idle entitlement Cost per job-minute Warm-pool waste Artefact TB by class Security signal Trust misclassification Egress denials Limit-breach kills Unsigned artefacts Overrides used Developer experience Validation error clarity Wait visibility Flake rate per pipeline Log tail lag Lead time to prod CI/CD Platform — Observability Coverage Empty cells are deliberate: cost is not attributed at admission, and promotion has no security signal beyond the override count. v 1.0 · owner Platform Engineering · date 2026-09

The number that decides everything

  • Infrastructure-failure ratio — jobs failed for platform reasons as a share of all jobs — is the single signal that decides whether engineers trust a red build. It is bounded at ≤ 0.5% weekly and alerts at 1.0% hourly.
  • Flake rate is measured but deliberately not bounded. The platform's obligation is detection; fixing a flaky test belongs to the team that owns it.
  • Trust misclassification is a correctness signal on admission and is a Sev-1 at any non-zero value.

Deliberate gaps

  • No cost signal at admission or promotion: neither consumes attributable compute, and inventing an allocation would make the cost-per-job-minute figure less honest.
  • No security signal at the queue: a queued job holds no credential and touches no tenant data.

Assumptions

  • All-in cost target ≤ $0.011 per job-minute at p50 utilisation; elevated infra-failure ratio detected within 5 minutes.